Week 3
Notre Dame Stadium

Texas A&M41 @FINAL 40Notre Dame , Week 3, Sep 13, 2025

2-0 SEC Power rating: 20.2
0-1 Independent Power rating: 25.9

How did the line hold up?

Market line
ND -6.5
PM Implied
ND -4.8
Blue Chip model
ND -8.9
Edge
+2.4ND
See details
◂ favors TA&Mfavors ND ▸Market: ND -6.5
5.7 › ND
Adjust the power ratings by team
The power ratings row was edited directly, please click reset to adjust by team
ND
ND
ND
no impact
no impact
1 TA&M1 ND2 TA&M2 NDModel: ND -8.9

Betting information

Spread
ND -6.5
Total
49.5
Odds implied score
TA&M 21.5 – 28.0 ND
Prediction markets
ND 69% win chance (Kalshi)

DraftKings · as of July 8, 2026

Texas A&M defeated Notre Dame 41–40 in a nail-biter. Texas A&M covered by 7.5; Game went Over by 31.5. The market closed at Notre Dame -6.5 and the Blue Chip model made it Notre Dame -8.9, an edge of 2.4 points toward Notre Dame. Blue Chip Analytics had rated Notre Dame 5.7 points stronger on a neutral field.

What were the weather conditions for Texas A&M vs Notre Dame?

At kickoff, conditions at Notre Dame Stadium were Clear, 66°F with winds of 7 mph. Weather is not expected to be a meaningful factor in this game. Historical weather data for this game is preserved in the panel alongside. Weather data is sourced from WeatherAPI.com.

What happened in the game?

Texas A&M travels 949 miles to this game, a significant road trip.

Texas A&M arrives with a 1-hour eastward body clock shift, short of the two-zone westward threshold where travel starts to price.

Texas A&M won by 1 in a nail-biter.

Texas A&M covered the spread by a solid margin.

The total went Over by 31.5 points.

How do Texas A&M and Notre Dame compare on power ratings?

Blue Chip Analytics power ratings favor Notre Dame (25.9) over Texas A&M (20.2) by 5.7 points on a neutral field. After adding home field advantage, the rating-implied line may differ meaningfully from the market spread. Notre Dame brings a meaningful home field advantage to this matchup (Blue Chip HFA: 2.2). Add this to the neutral-site differential to arrive at a venue-adjusted line.

Blue Chip Analytics power ratings represent expected point margin against an average FBS opponent on a neutral field, calculated from game data sourced via CollegeFootballData.com (CFBD). They are one input: cross-reference with the travel, rest, and weather data above before drawing conclusions.

Sources

Weather

Texas A&M won and Texas A&M covered the spread.

Conditions

as of September 13, 2025 Game-time

Clear

66°F

Rain0%
Precip0.00"
Humidity70%
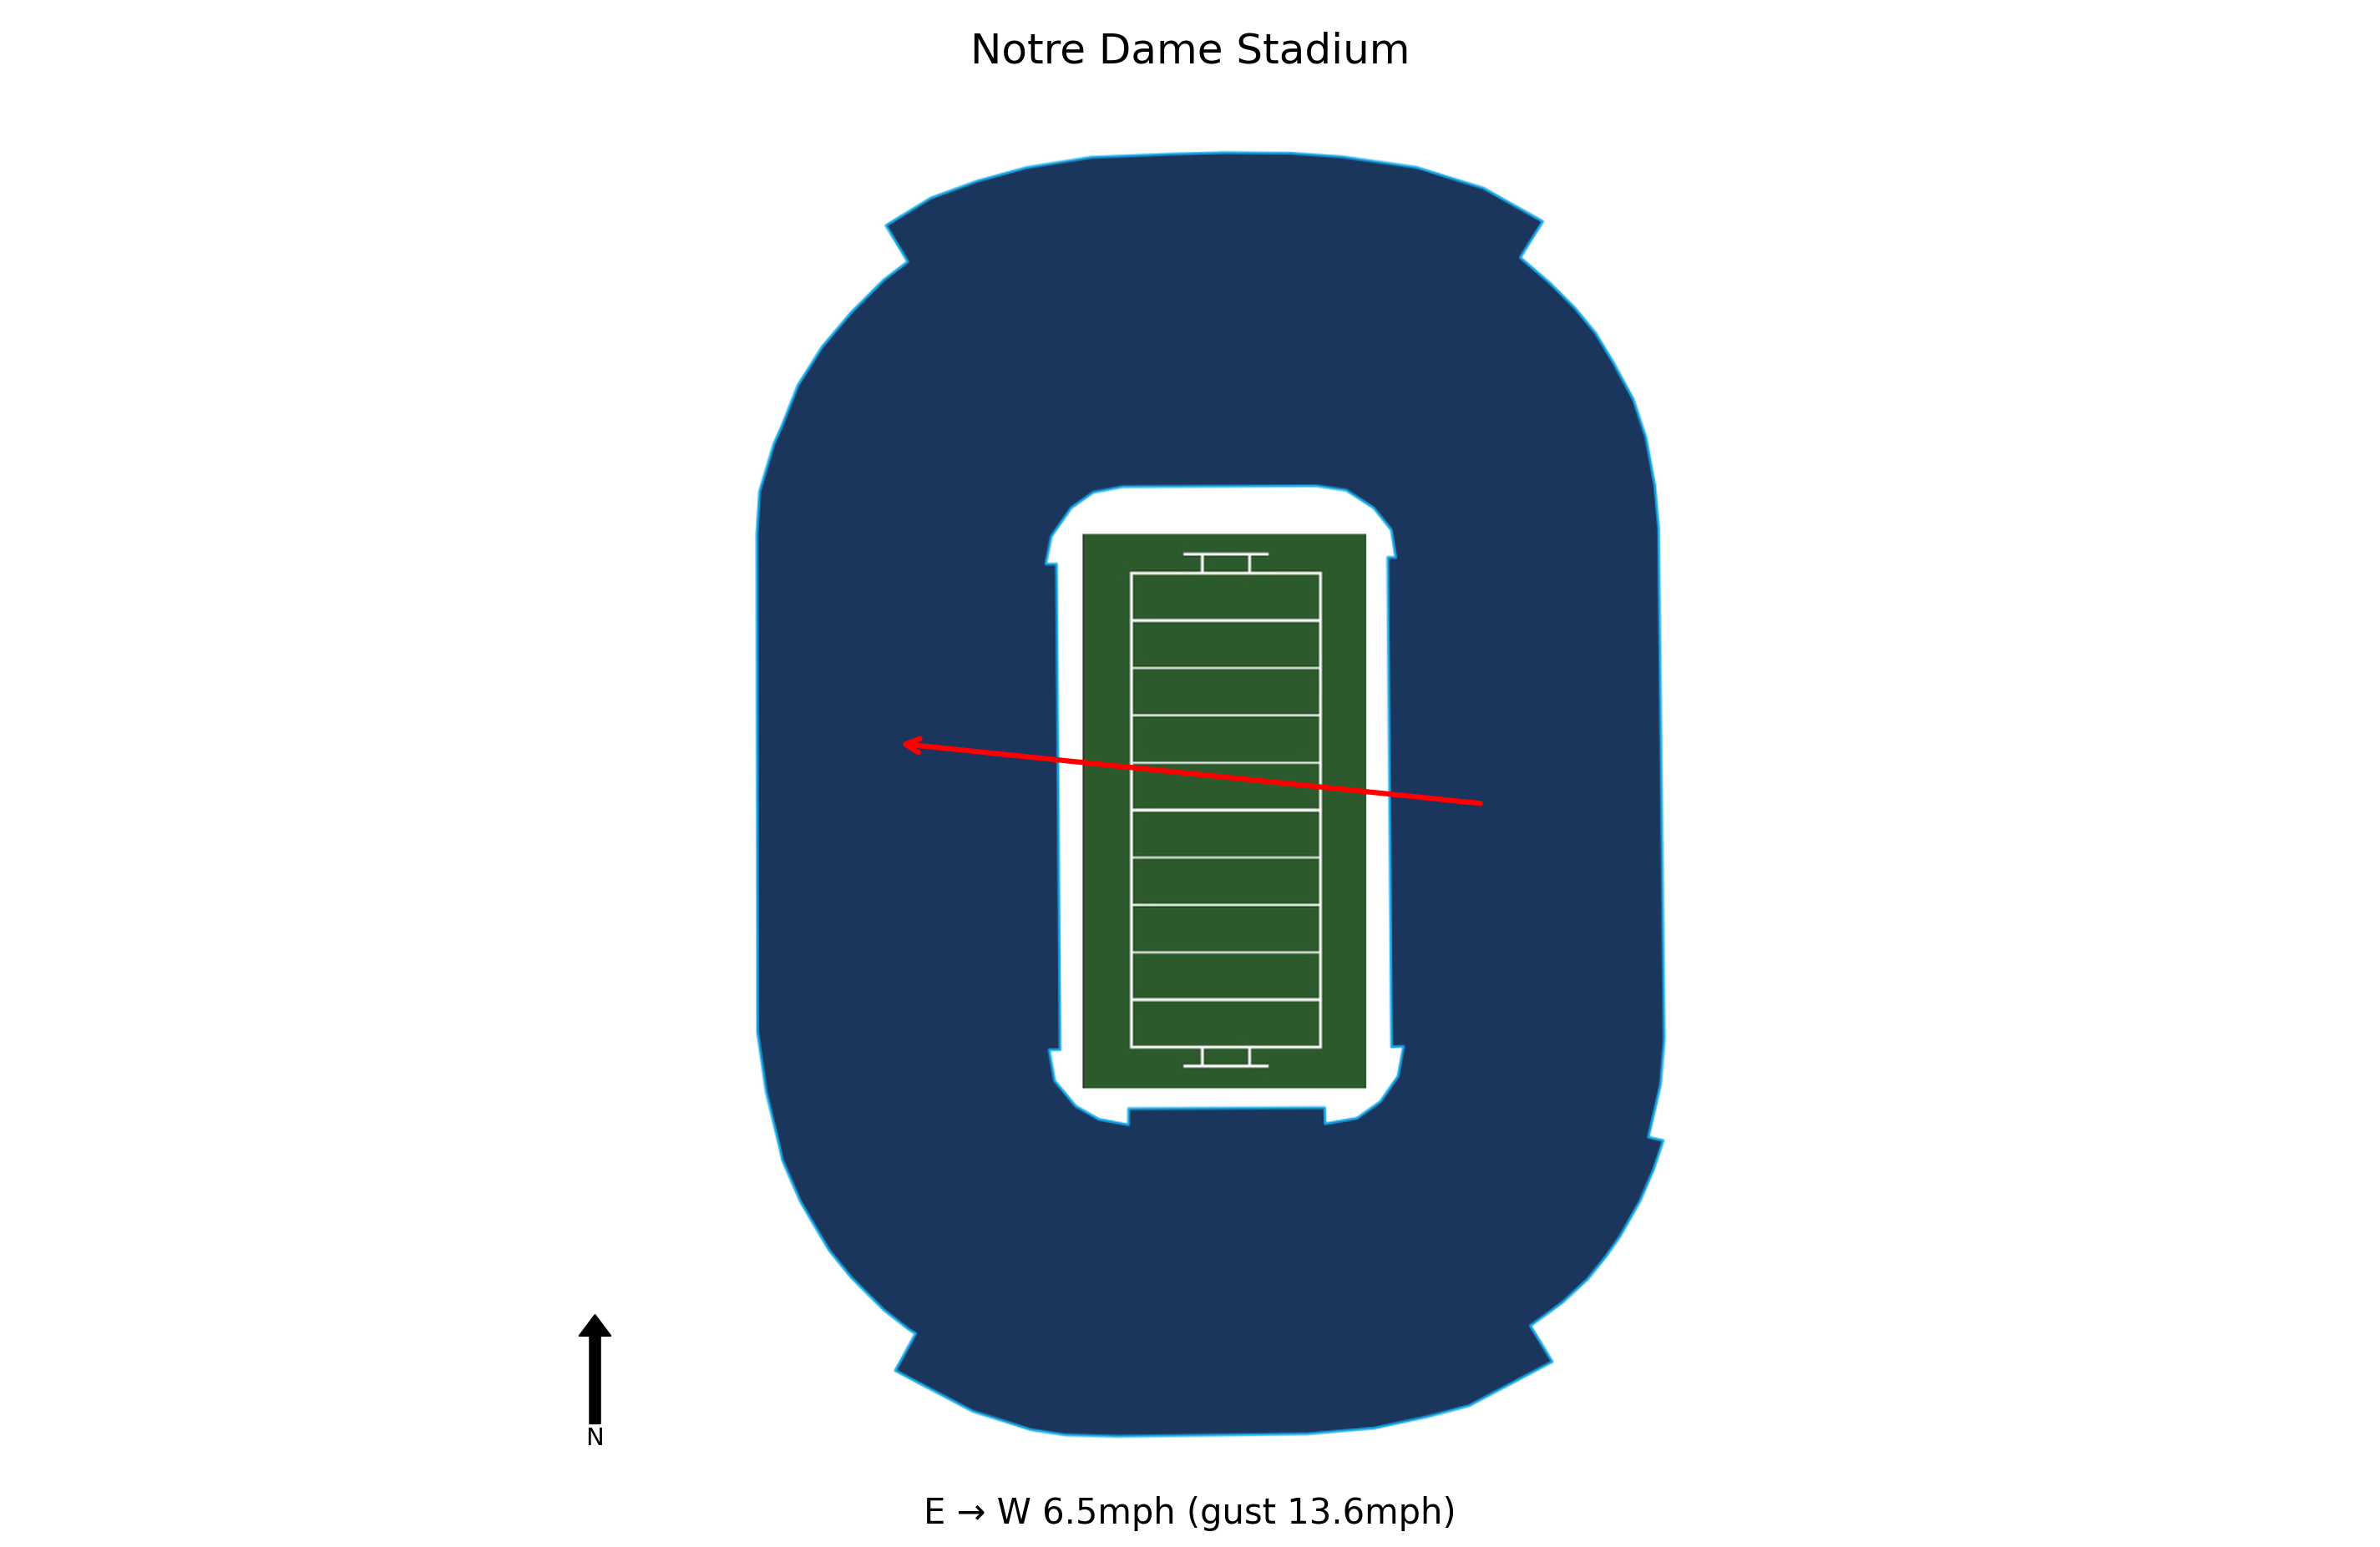
Wind7 mph E
Gusts14 mph
Wind map for Texas A&M at Notre Dame: aerial view of Notre Dame Stadium, wind from the E at 6.5 mph, gusting to 13.6 mph

Quick facts

Week
Week 3
Kickoff (local)
07:30 PM EDT
Venue
Notre Dame Stadium
Capacity
77,622
Elevation
755 ft
Surface
Artificial Turf

Travel and rest

Measure Texas A&MAway Notre DameHome
This week949 miles0 miles
Last weekHome gameBye week
Season total949 miles2,275 miles
Body clock18:3019:30
Rest7 days13 days