Week 6October 04, 2025, 05:00 PM UTC
21
2-2
American
Power Rank: -1.8
@
FINAL
27
2-2
American
Power Rank: -10.0

By · Last updated

Temple defeated UTSA 27–21 in a closely contested finish. Temple covered by 12.5; Game went Under by 10.5. Blue Chip Analytics had rated UTSA 8.2 points stronger on a neutral field.

General Information

Week: Week 6
Kick Off (at stadium): 01:00 PM EDT
Stadium: Lincoln Financial Field
Capacity: 67,594
Elevation: 43 ft
HFA Rating: 2.7
Playing Surface: Hybrid

Betting Information

Spread UTSA -6.5
Total (O/U) 58.5
Odds Implied Score UTSA 32.5 - 26.0 TEM
Power Rank Implied Line UTSA -8.2
UTSA @ Temple Preview

Line Value Calculator

Adjust any factor to update your projected line

Your line Temple -8.2
Implied value
Current line - edit to adjust
Temple perspective
Power ratings - edit to adjust
UTSA
Temple
Home field: Lincoln Financial Field
Weather: Sunny
Travel impact

Positive adjustment = favours home team

What were the weather conditions for UTSA vs Temple?

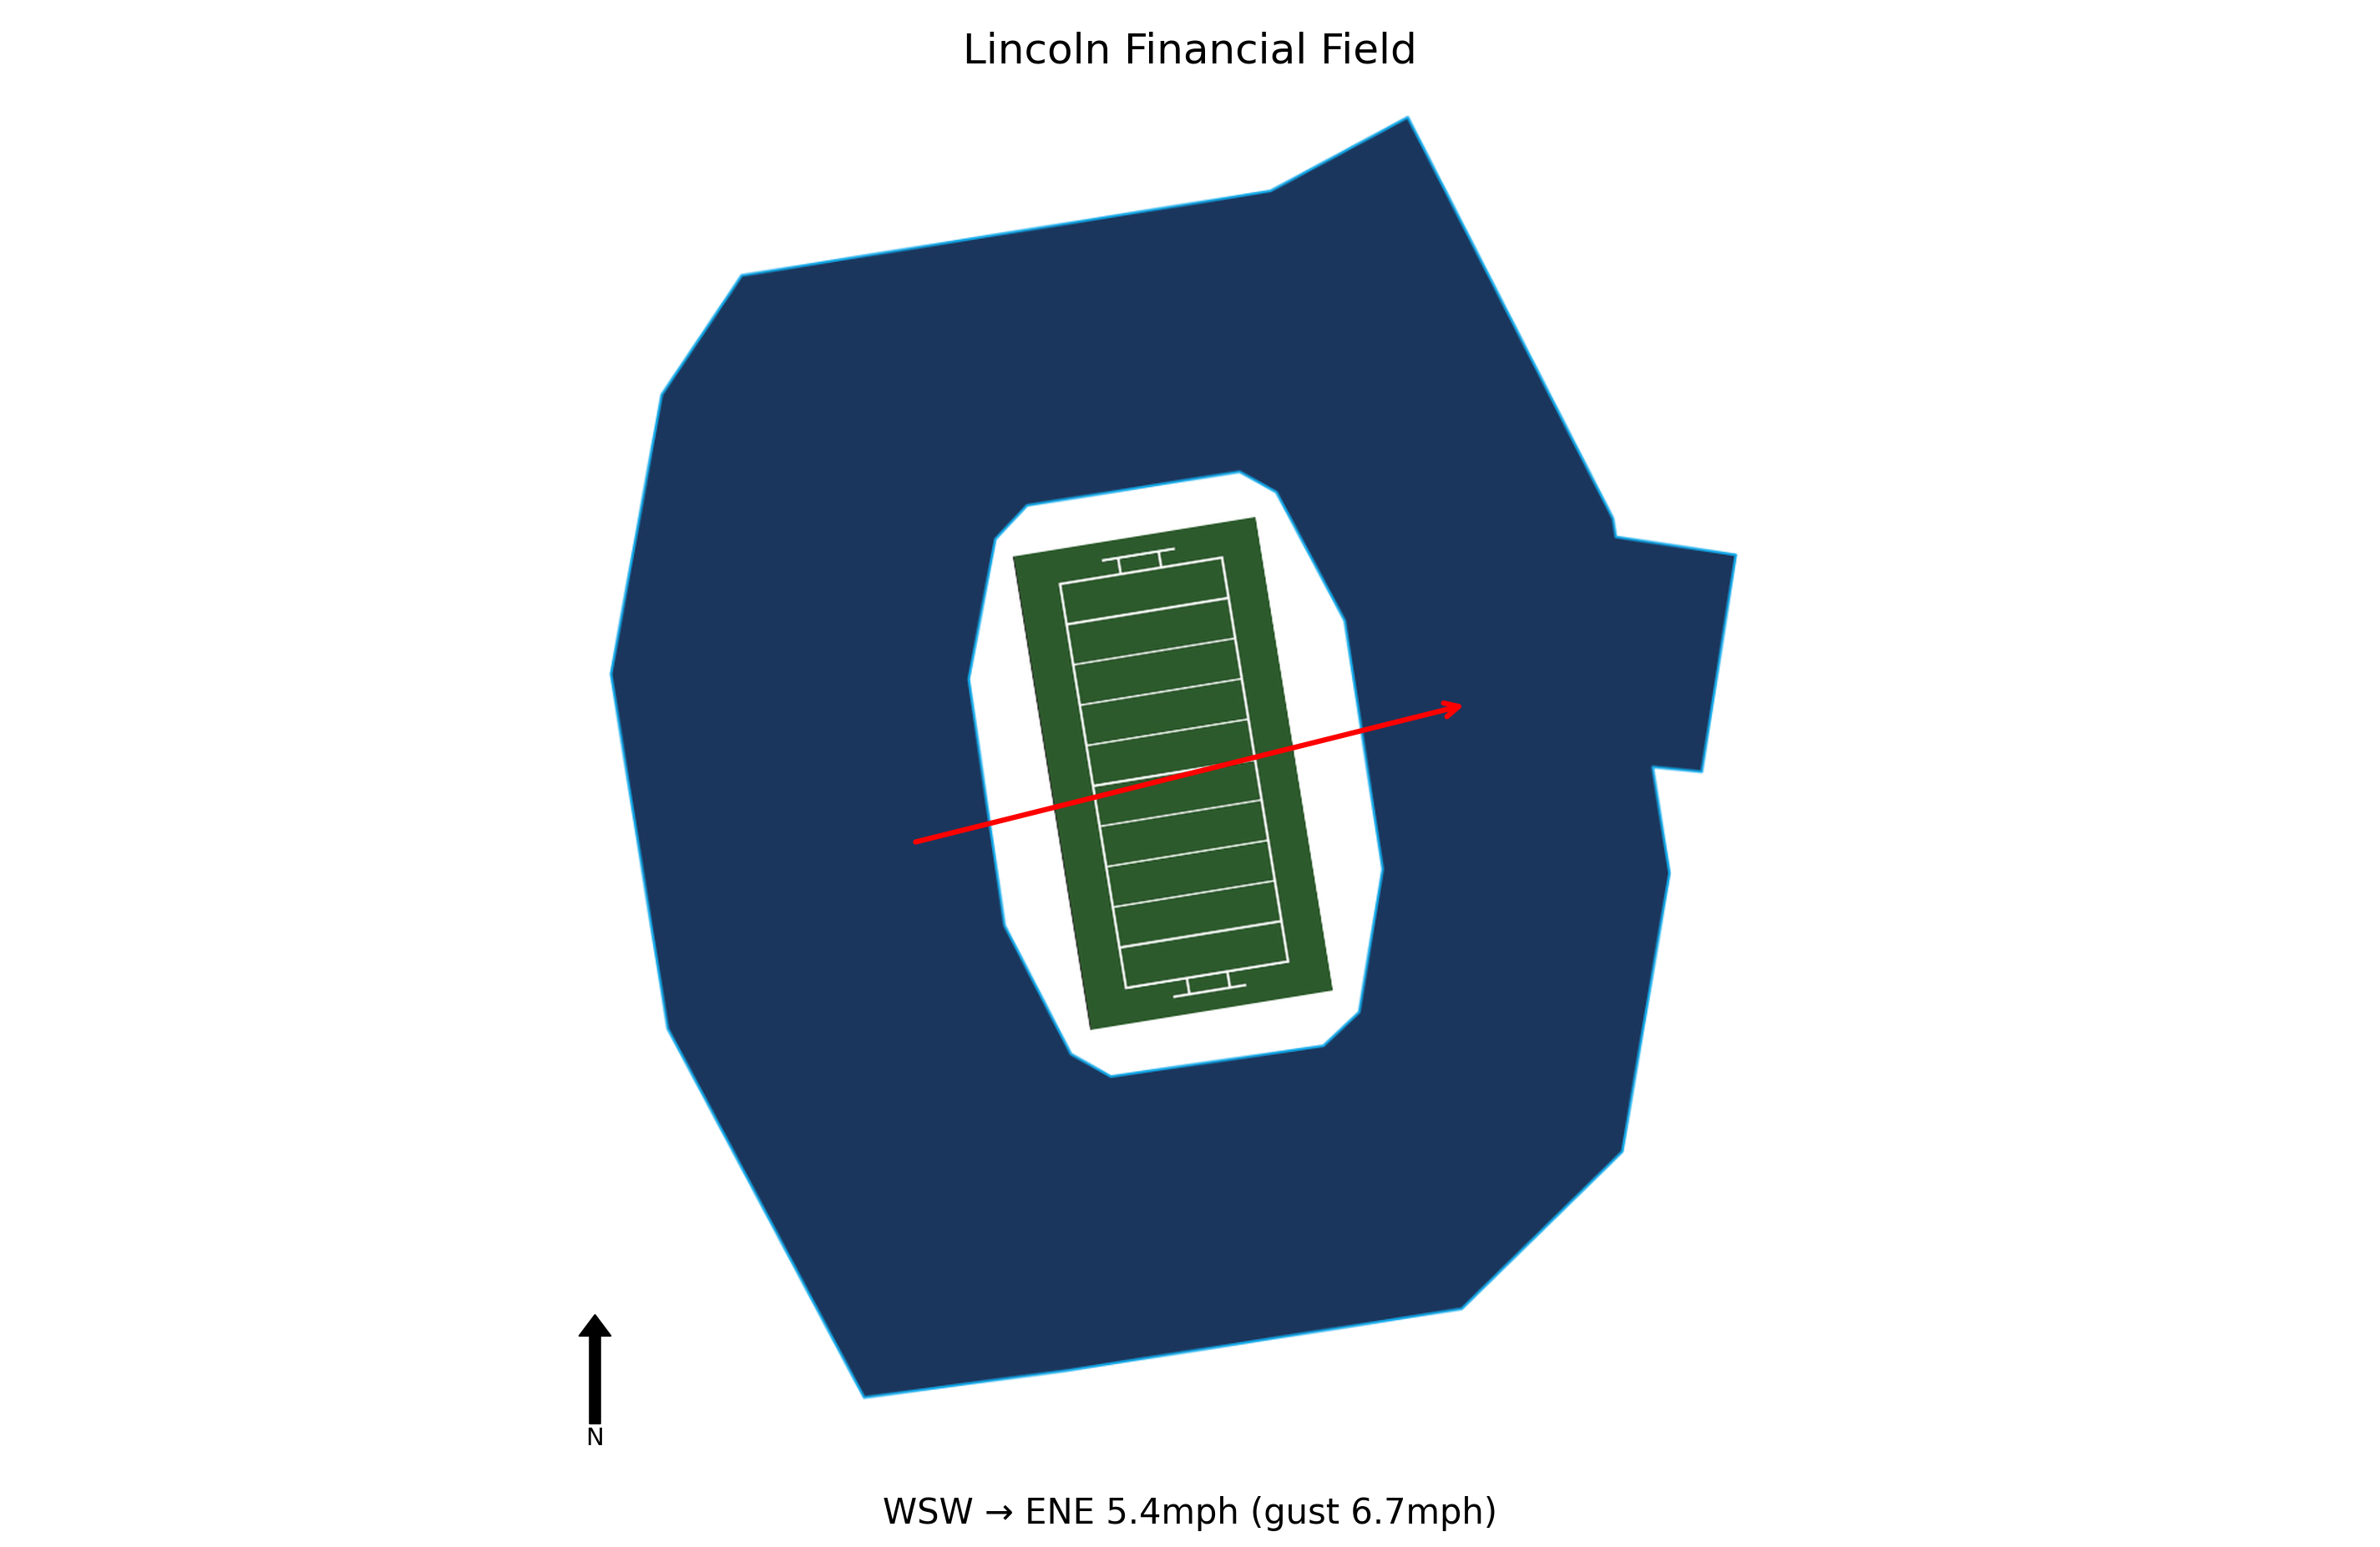
At kick-off, conditions at Lincoln Financial Field were Sunny, 79.3°F, Heat Index 81.0°F with winds of 5.4 mph. Weather is not expected to be a meaningful factor in this game. Historical weather data for this game is preserved in the panel below.

Weather Conditions

Forecast for: October 04, 2025
Sunny

Sunny

79.3°F

Heat Index: 81.0°F
Wind: 5.4 mph WSW
Gusts: 6.7 mph
Precipitation: 0.0"
Humidity: 47%
Rain Chance: 0%
Snow Chance: 0%

Travel & Rest

UTSA (Away)

This Week: 1505.1 miles
Last Week: No Game
Season Total: 3518.9 miles
Body Clock Time: 12:00
Rest Days: 13

Temple (Home)

This Week: 0.0 miles
Last Week: No Game
Season Total: 1763.8 miles
Body Clock Time: 13:00
Rest Days: 14

What are the key factors for UTSA vs Temple?

UTSA: Key Factors

Second-half collapse

UTSA dominated the first half, leading 14-3, but were outscored 24-7 in the second half, managing only 41 yards and two first downs in the fourth quarter.

Turnover issues

Quarterback Owen McCown threw two interceptions, including one that led directly to a Temple touchdown, and the team turned the ball over on downs twice in the fourth quarter.

Offensive inconsistency

Despite a strong first half with 178 yards, the offense stalled after halftime, failing to sustain drives and relying on big plays that were not sustained.

Defensive struggles in second half

After holding Temple to 108 yards in the first half, the defense allowed 219 yards in the second half, including a 54-yard touchdown run and two passing touchdowns.

Missed opportunity in conference opener

UTSA lost their AAC opener despite a halftime lead, highlighting the need for better adjustments and execution in the second half moving forward.

Temple: Key Factors

Second-half offensive surge

After managing only 108 yards in the first half, Temple's offense exploded for 219 yards in the second half following coordinator Tyler Walker's move from the booth to the sidelines, indicating a potential adjustment that could carry over.

Key defensive stops

Temple's defense held UTSA to just 41 yards and two first downs in the fourth quarter, forcing two turnovers on downs and an interception, showcasing a strong closing ability that could be crucial in future games.

Big-play capability

Hunter Smith's 54-yard touchdown run and Evan Simon's two touchdown passes (including a 15-yarder to Peter Clarke) highlight Temple's ability to generate explosive plays, which could be a key factor in upcoming matchups.

What happened in the game?

UTSA travels 1,505 miles to this game, a cross-country trip.

UTSA arrives with a 1-hour body clock shift.

Temple won by 6 in a closely contested finish.

Temple covered the spread by a solid margin.

The total went Under by 10.5 points.

How do UTSA and Temple compare on power ratings?

Blue Chip Analytics power ratings favour UTSA (-1.8) over Temple (-10.0) by 8.2 points on a neutral field. Despite playing at home, Temple faces a power rating deficit. Check whether the market spread accounts for this gap. Temple brings a meaningful home field advantage to this matchup (Blue Chip HFA: 2.7). Add this to the neutral-site differential to arrive at a venue-adjusted line.

Blue Chip Analytics power ratings represent expected point margin against an average FBS opponent on a neutral field, calculated from game data sourced via CollegeFootballData.com (CFBD). They are one input: cross-reference with the travel, rest, and weather data above before drawing conclusions.

Sources

Weather

Temple won and Temple covered the spread.