Week 3 •
SHI Stadium

Norfolk State10 @FINAL 60Rutgers , Week 3, Sep 13, 2025

0-0 MEAC Power rating: -32.0
2-0 Big Ten Power rating: 2.1

How did the line hold up?

Market line
RUTG -44.5
PM Implied
RUTG -22.6
Blue Chip model
RUTG -36.0
Edge
-8.5NORF
See details
◂ favors NORFfavors RUTG ▸Market: RUTG -44.5
34.1 › RUTG
Adjust the power ratings by team
The power ratings row was edited directly, please click reset to adjust by team
RUTG
no impact
no impact
no impact
no impact
5 NORF5 RUTG10 NORF10 RUTGModel: RUTG -36.0

Betting information

Spread
RUTG -44.5
Total
56.5
Odds implied score
NORF 6.0 – 50.5 RUTG
Prediction markets
RUTG 97% win chance (Kalshi)

DraftKings · as of July 8, 2026

Rutgers defeated Norfolk State 60–10 in a dominant performance. Rutgers covered by 5.5; Game went Over by 13.5. The market closed at Rutgers -44.5 and the Blue Chip model made it Rutgers -36.0 - a gap of 8.5 points toward Norfolk State, of which 7.8 points were beyond the model's measured factors. That was an information gap - the market pricing something the model does not carry - rather than a measured edge.

What were the weather conditions for Norfolk State vs Rutgers?

At kickoff, conditions at SHI Stadium were Partly cloudy, 74°F with winds of 10 mph. Weather is not expected to be a meaningful factor in this game. Historical weather data for this game is preserved in the panel alongside. Weather data is sourced from WeatherAPI.com.

What happened in the game?

Norfolk State travels 271 miles to this game, a short road trip.

The trip crosses none of the distance or time-zone thresholds that have measured a price, so travel is not a factor here.

Rutgers won by 50 in a dominant performance.

Rutgers covered the spread.

The total went Over by 13.5 points.

How do Norfolk State and Rutgers compare on power ratings?

Blue Chip Analytics power ratings favor Rutgers (2.1) over Norfolk State (-32.0) by 34.1 points on a neutral field. After adding home field advantage, the rating-implied line may differ meaningfully from the market spread. Rutgers brings a modest home field advantage to this matchup (Blue Chip HFA: 1.9). Add this to the neutral-site differential to arrive at a venue-adjusted line.

Blue Chip Analytics power ratings represent expected point margin against an average FBS opponent on a neutral field, calculated from game data sourced via CollegeFootballData.com (CFBD). They are one input: cross-reference with the travel, rest, and weather data above before drawing conclusions.

Sources

Weather

Rutgers won and Rutgers covered the spread.

Conditions

as of September 13, 2025 Game-time

Partly cloudy

74°F

Rain0%
Precip0.00"
Humidity65%
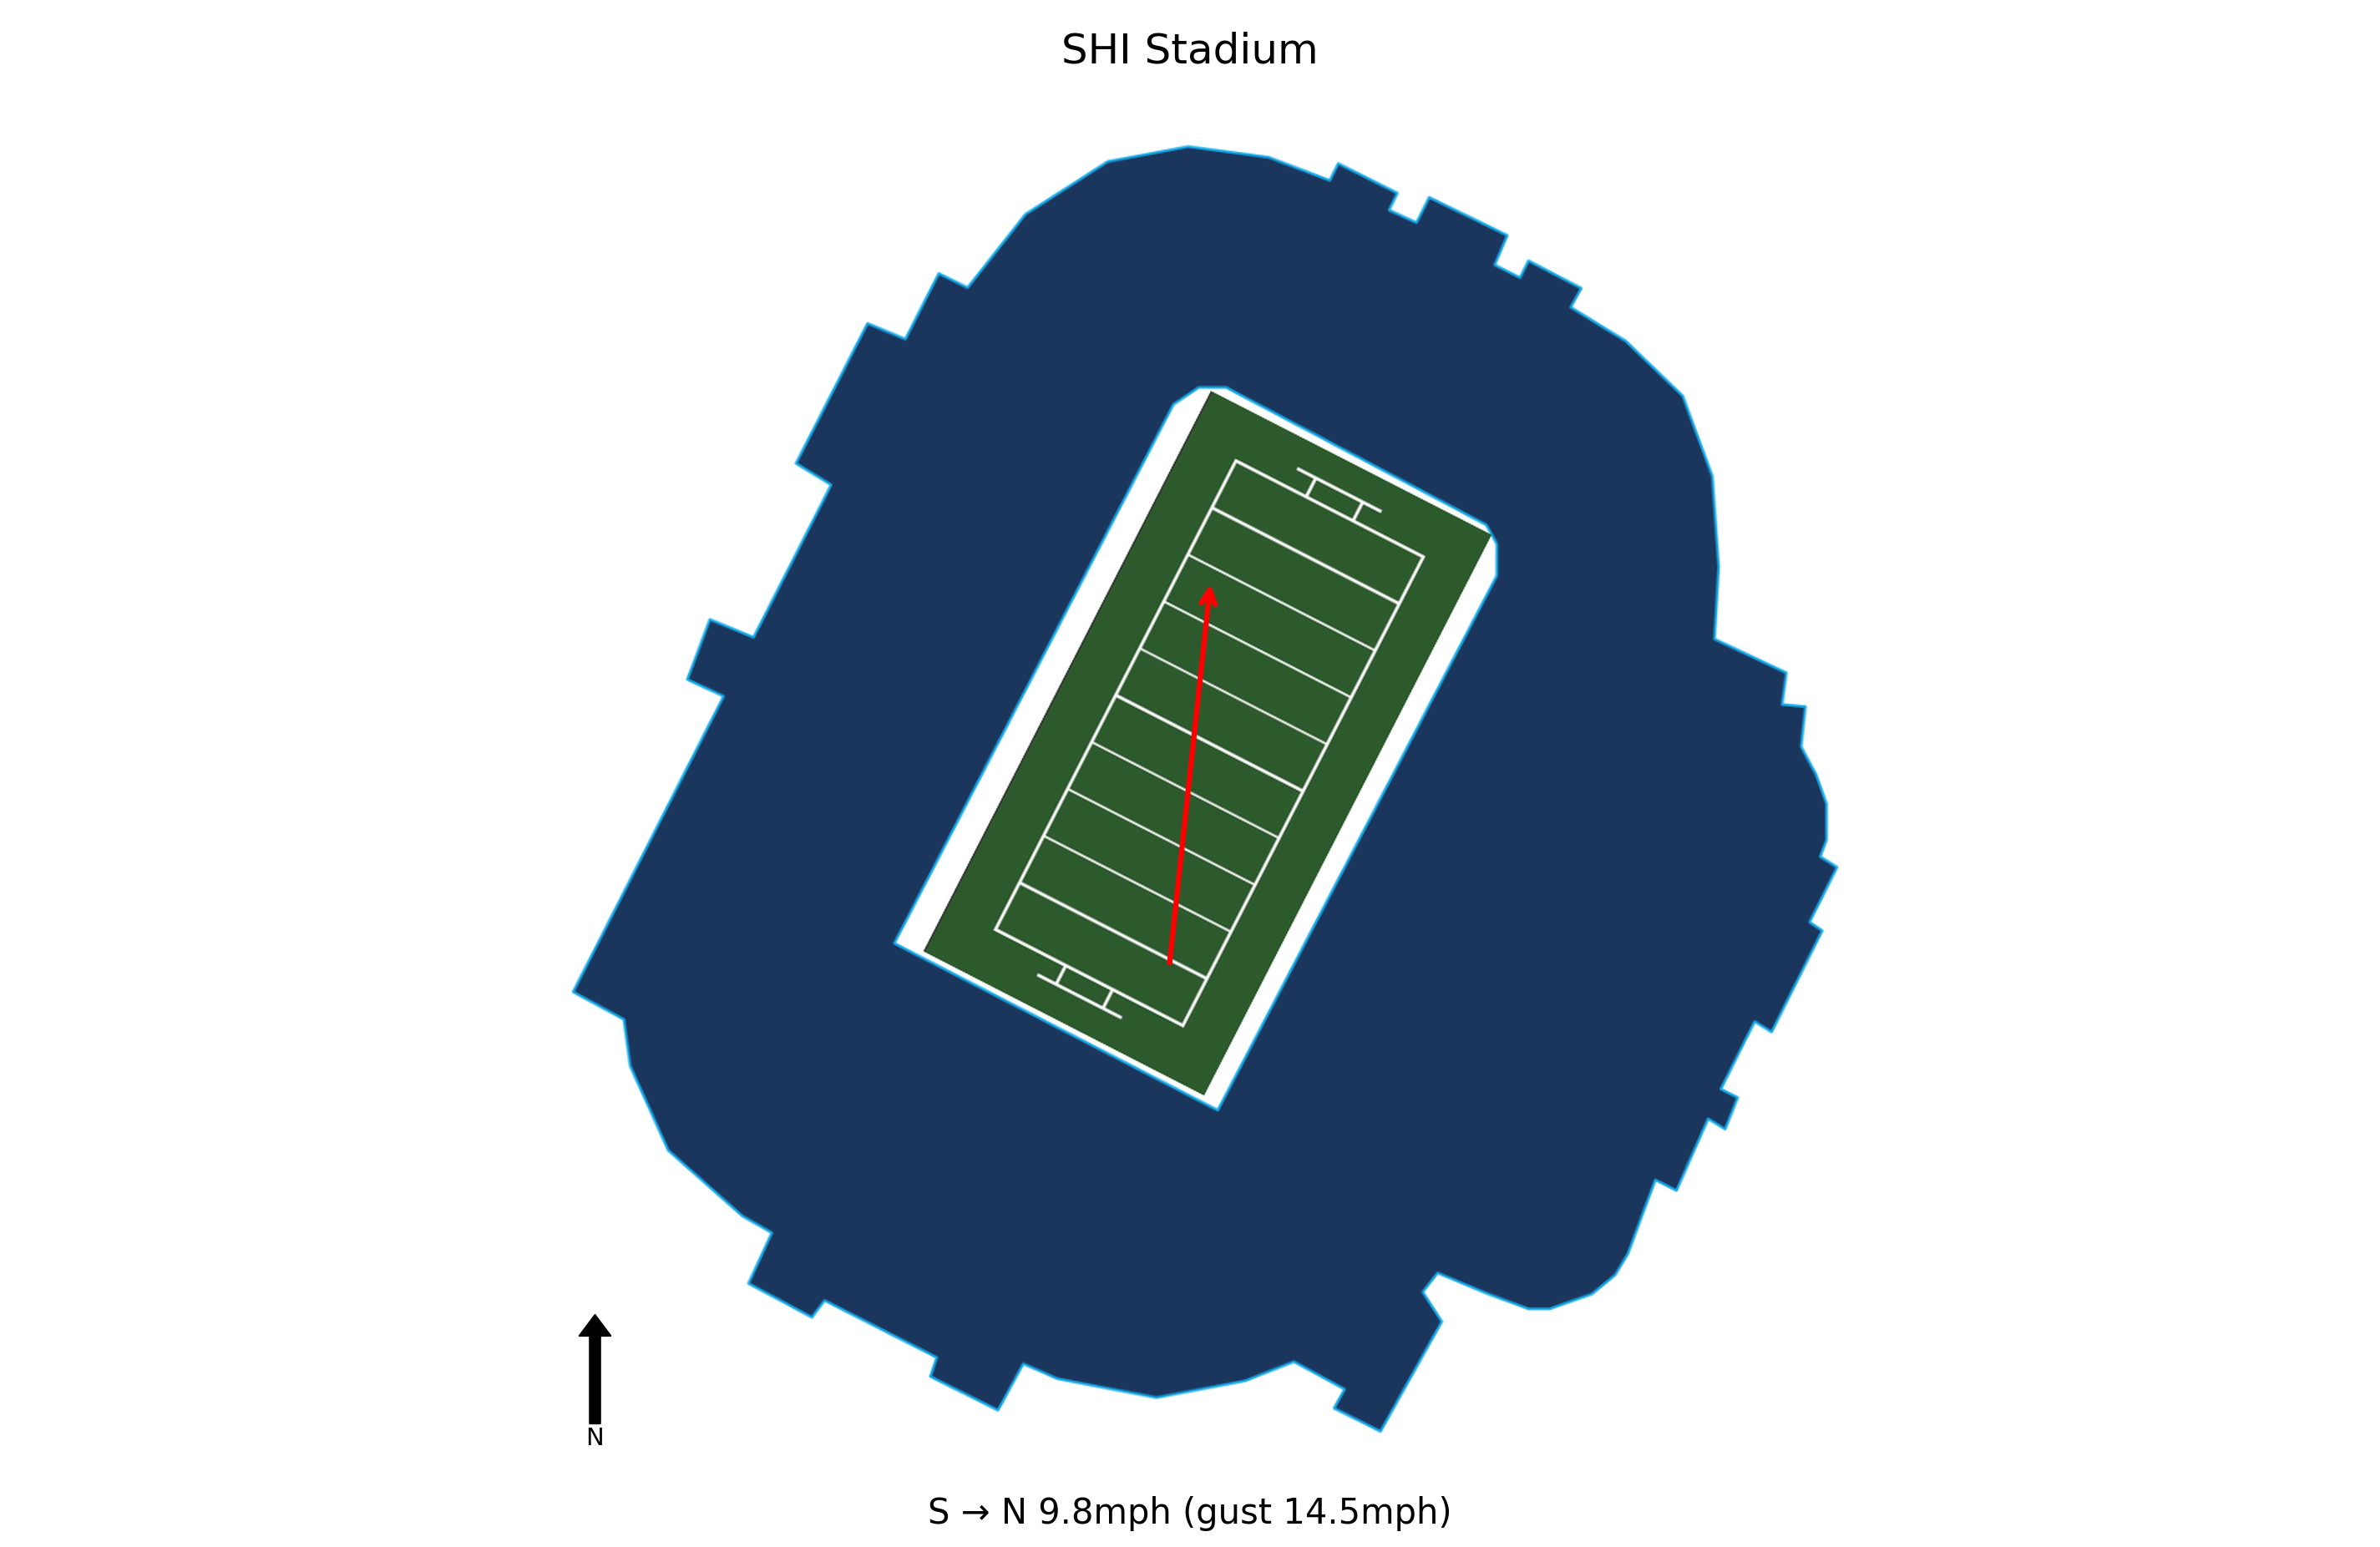
Wind10 mph S
Gusts15 mph
Wind map for Norfolk State at Rutgers: aerial view of SHI Stadium, wind from the S at 9.8 mph, gusting to 14.5 mph

Quick facts

Week
Week 3
Kickoff (local)
03:30 PM EDT
Venue
SHI Stadium
Capacity
52,454
Elevation
69 ft
Surface
Artificial Turf

Travel and rest

Measure Norfolk StateAway RutgersHome
This week271 miles0 miles
Last weekBye weekHome game
Season total271 miles0 miles
Body clock15:3015:30
Rest7 days7 days