DraftKings · as of July 8, 2026
California defeated Louisville 29–26 in a nail-biter. California covered by 21.5; Game went Over by 6.5. The market closed at Louisville -18.5 and the Blue Chip model made it Louisville -20.6, an edge of 2.1 points toward Louisville. Blue Chip Analytics had rated Louisville 16.7 points stronger on a neutral field.
Louisville's offense, led by Miller Moss (20/38, 203 yards, 1 rushing TD), was held to 351 total yards and failed to capitalize on scoring opportunities, settling for field goals in overtime. The passing attack was limited to 203 yards, well below their usual high-octane standard.
The defense allowed 427 total yards and 29 points, including a game-winning touchdown in overtime. Despite forcing a field goal in OT, they couldn't stop Cal's aggressive offense on fourth down, highlighting issues in high-pressure situations.
Louisville committed the game's only turnover (an interception by Hezekiah Masses), which led to a Cal field goal. The Cardinals failed to force any turnovers, losing the turnover battle and missing a chance to gain an edge in a tight game.
Louisville led for most of the first half but had to rally after halftime, tying the game with a field goal. They couldn't build on leads and lost in overtime, continuing a pattern of struggling to finish games against ACC newcomers (0-3 vs. Stanford, SMU, Cal).
Keyjaun Brown rushed for 136 yards on 14 carries, and Duke Watson scored a rushing touchdown. Kicker Cooper Ranvier made four field goals (49, 49, 39, 30 yards), but the offense's inconsistency and defensive breakdowns overshadowed these performances.
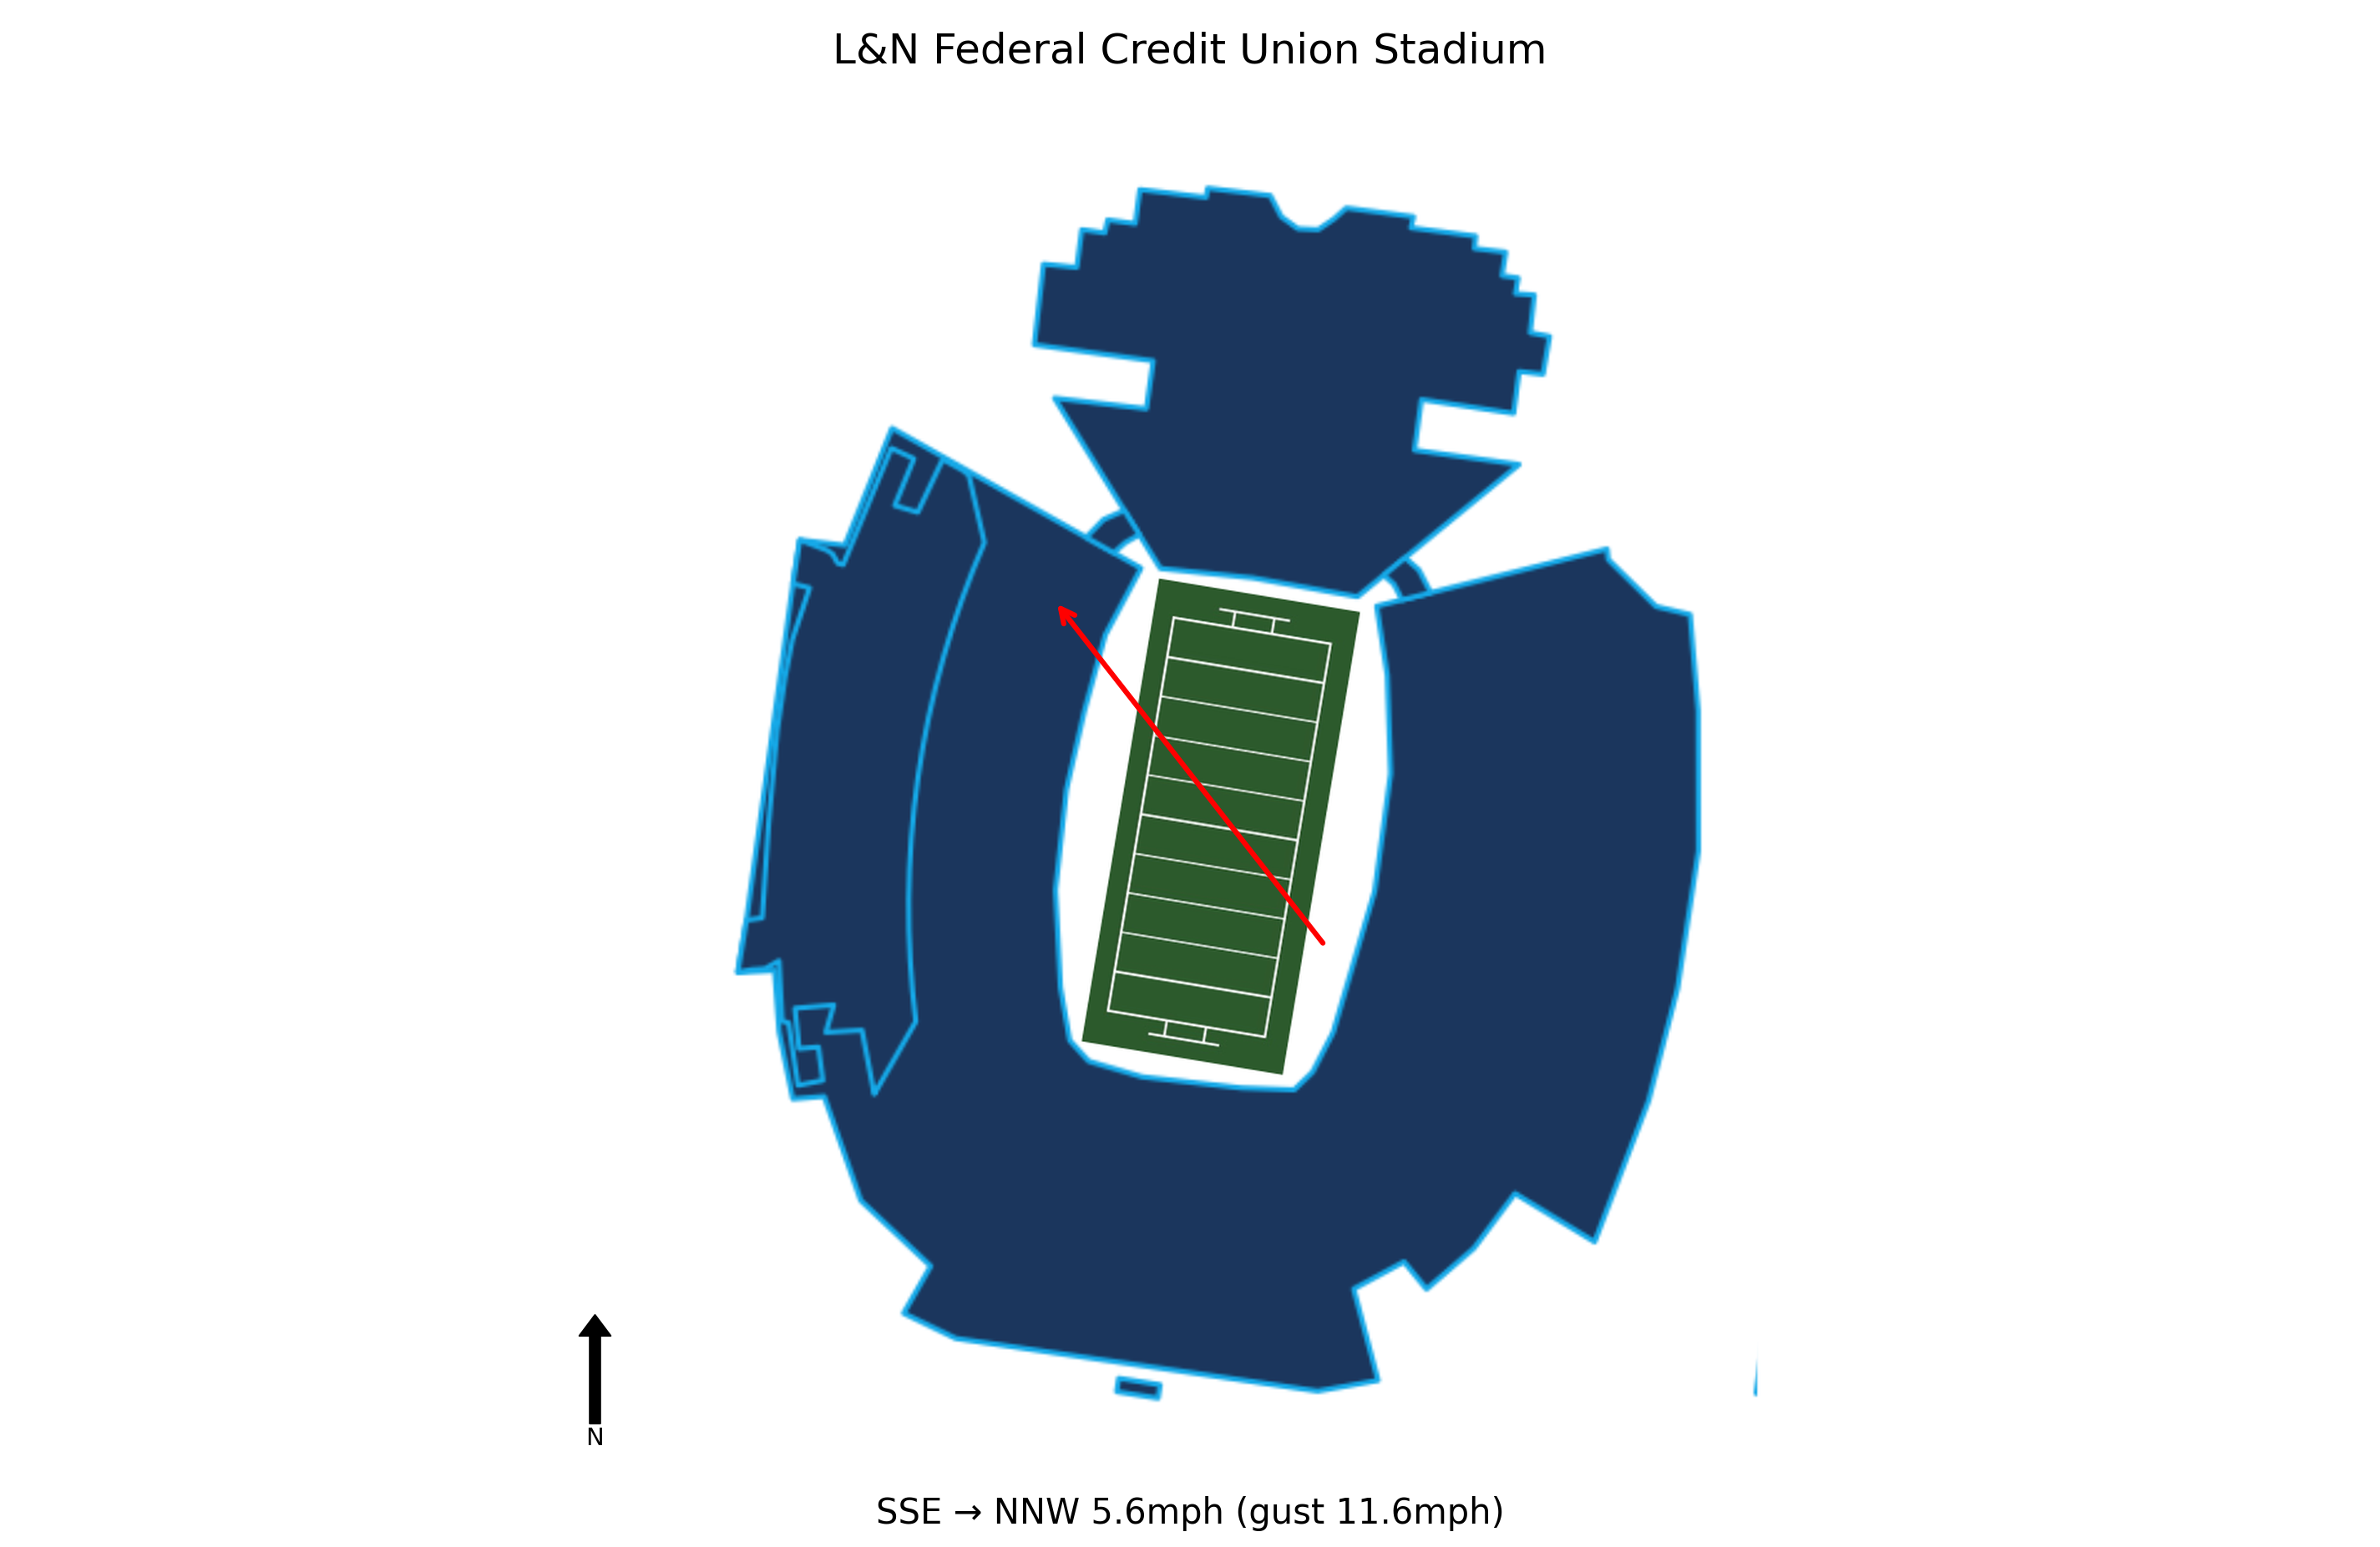
At kickoff, conditions at L&N Federal Credit Union Stadium were Overcast, 54°F with winds of 6 mph. Weather is not expected to be a meaningful factor in this game. Historical weather data for this game is preserved in the panel alongside. Weather data is sourced from WeatherAPI.com.

Overcast
54°F
| Measure | CaliforniaAway | LouisvilleHome |
|---|---|---|
| This week | 1,978 miles | 0 miles |
| Last week | Home game | 601 miles |
| Season total | 13,739 miles | 3,096 miles |
| Body clock | 16:00 | 19:00 |
| Rest | 8 days | 8 days |


.png)


