3
10-3
SEC
Power Rank: 30.2
@
FINAL
38
13-0
Big Ten
Power Rank: 33.7

By · Last updated

Indiana defeated Alabama 38–3 in a dominant performance. Indiana covered by 27.5; Game went Under by 5.5.

General Information

Week: Postseason
Kick Off (at stadium): 01:00 PM PST
Stadium: Rose Bowl
Capacity: 89,702
Elevation: 810 ft
HFA Rating: 0.0
Playing Surface: Grass

Betting Information

Spread Indiana -7.5
Total (O/U) 46.5
Odds Implied Score ALA 19.5 - 27.0 IU
Power Rank Implied Line Indiana -3.5
Alabama @ Indiana Preview

Line Value Calculator

Adjust any factor to update your projected line

Your line Indiana +3.5
Implied value
Current line - edit to adjust
Indiana perspective
Power ratings - edit to adjust
Alabama
Indiana
Home field: Rose Bowl
Weather: Partly cloudy
Travel impact

Positive adjustment = favours home team

What were the weather conditions for Alabama vs Indiana?

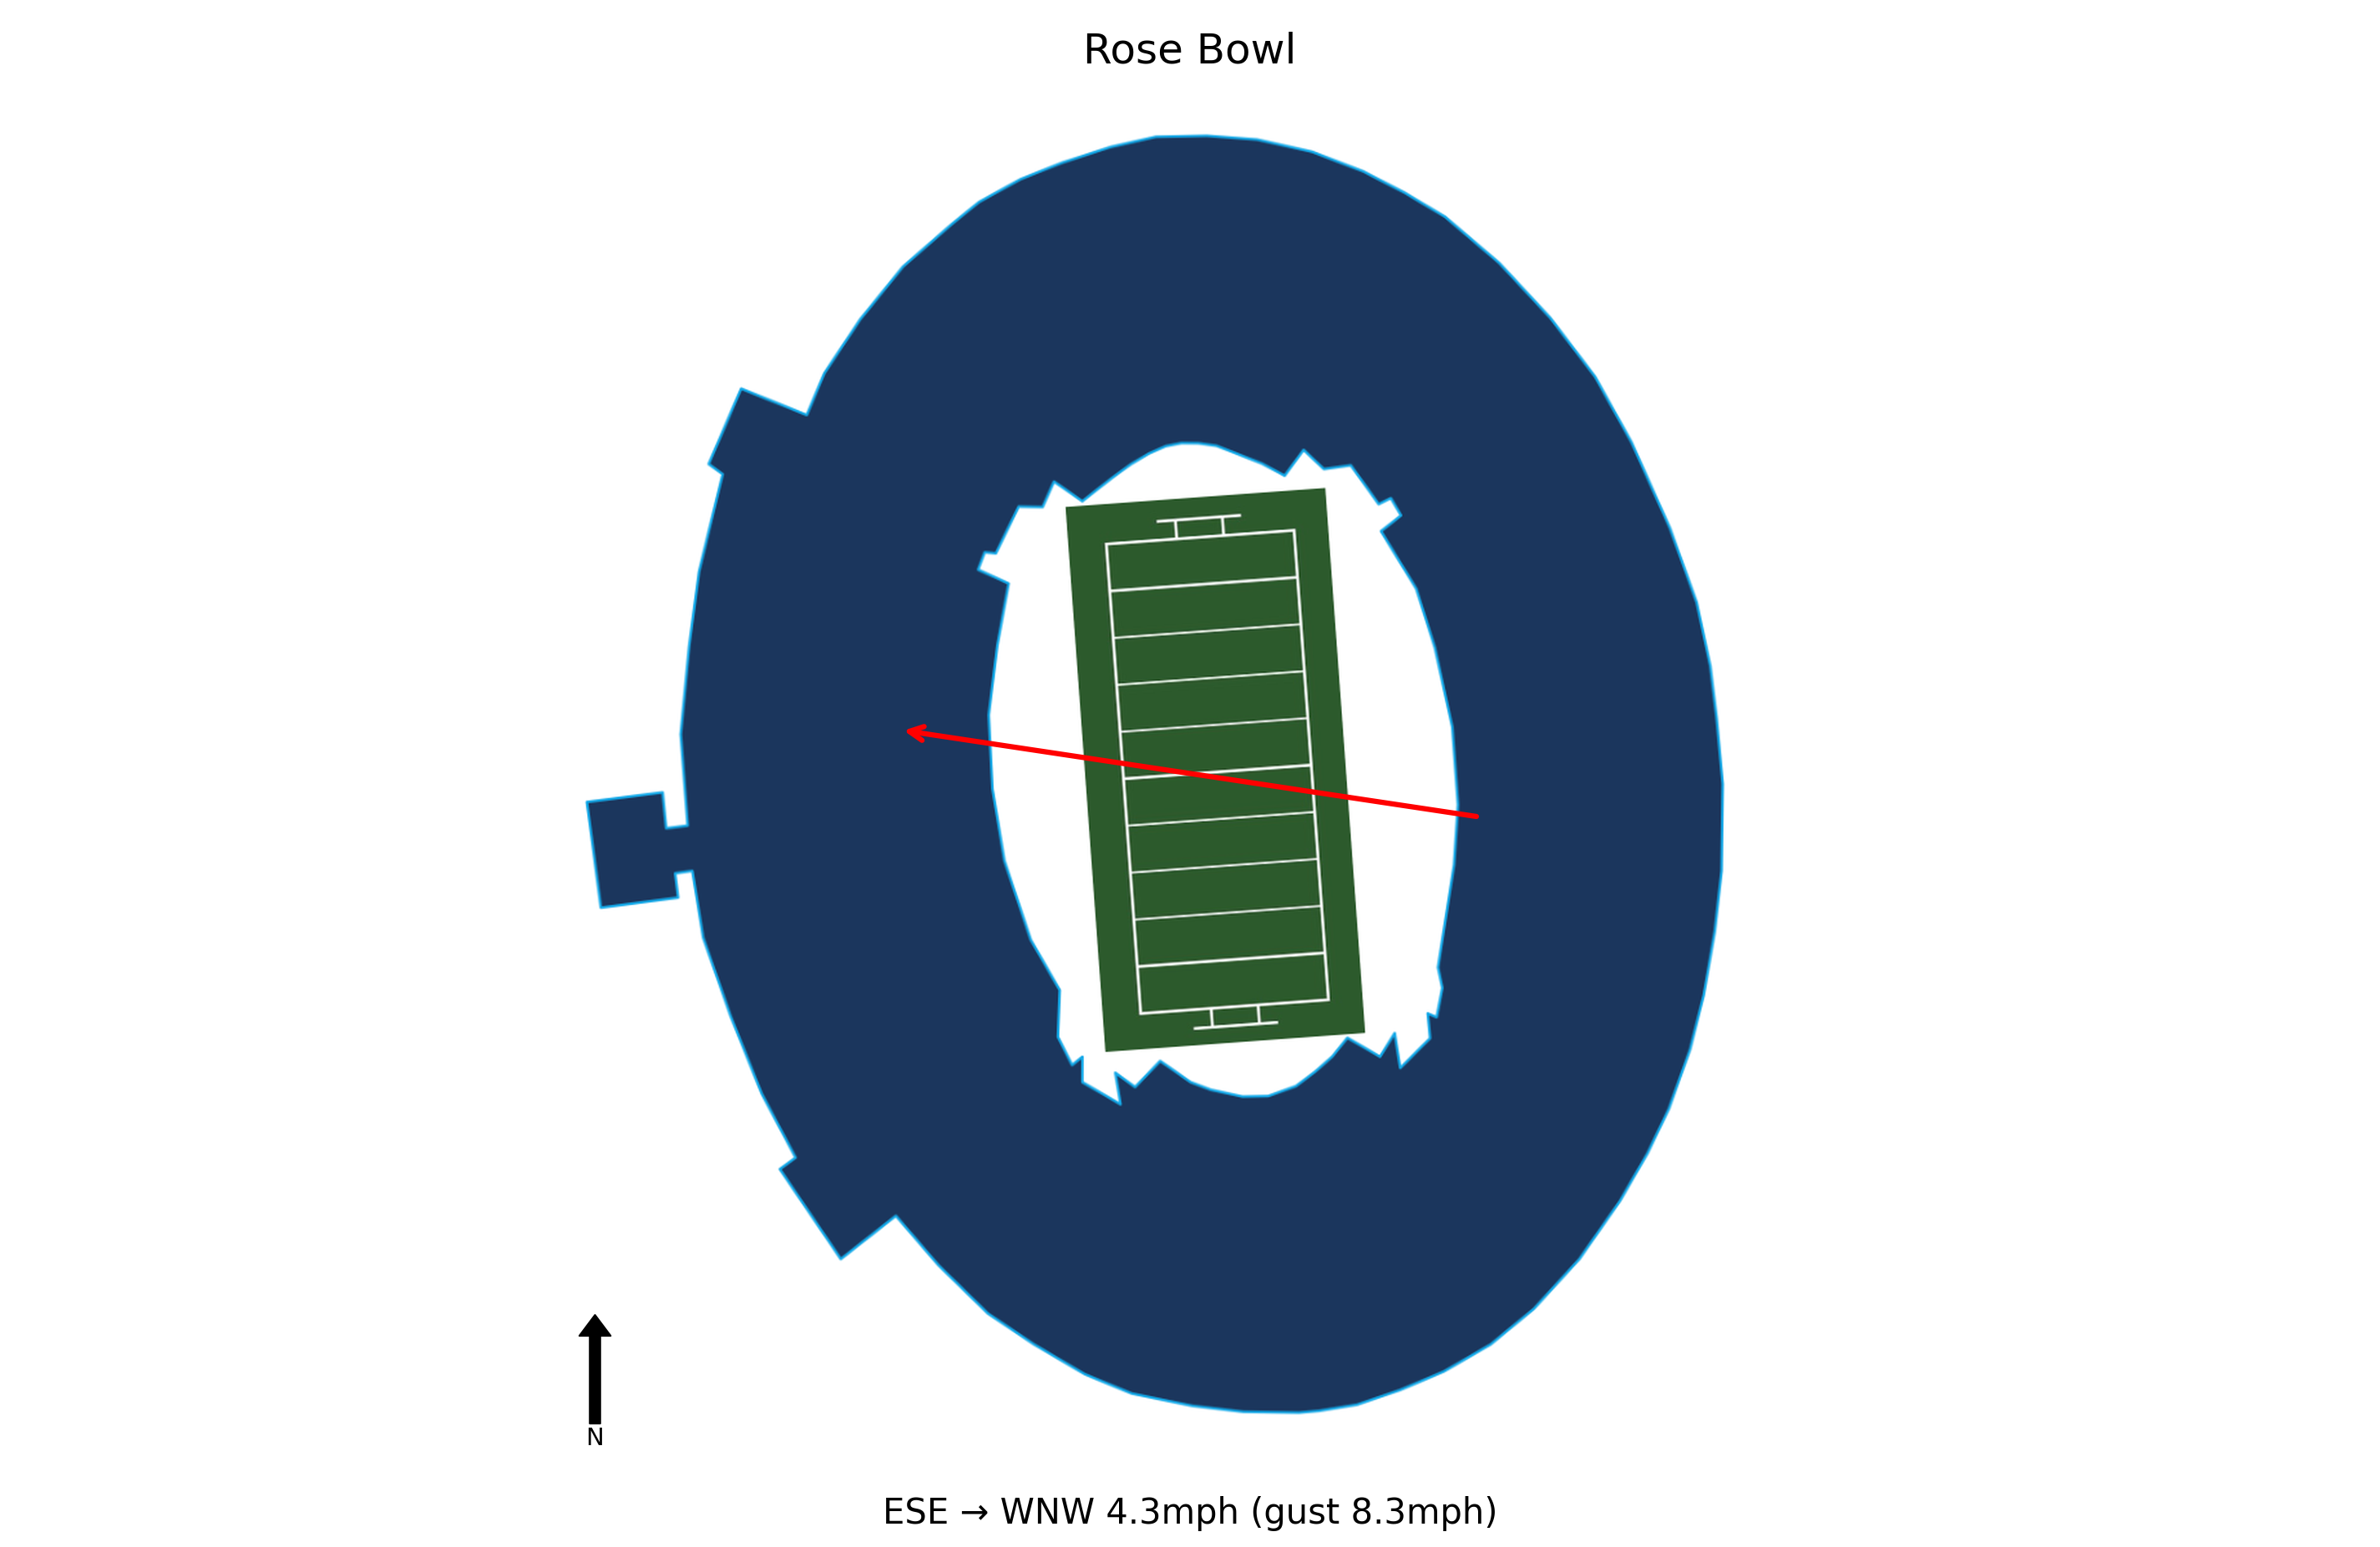
At kick-off, conditions at Rose Bowl were Partly cloudy, 57.7°F, Feels Like 58.6°F with winds of 4.3 mph. Weather is not expected to be a meaningful factor in this game. Historical weather data for this game is preserved in the panel below.

Weather Conditions

Forecast for: January 01, 2026
Partly cloudy

Partly cloudy

57.7°F

Feels Like: 58.6°F
Wind: 4.3 mph ESE
Gusts: 8.3 mph
Precipitation: 5.53"
Humidity: 93%
Rain Chance: 0%
Snow Chance: 0%

Travel & Rest

Alabama (Away)

This Week: 1758.7 miles
Last Week: No Game
Season Total: 5131.0 miles
Body Clock Time: 15:00
Rest Days: 26

Indiana (Home)

This Week: 1781.9 miles
Last Week: No Game
Season Total: 8467.6 miles
Body Clock Time: 16:00
Rest Days: 25

What happened in the game?

Alabama travels 1,759 miles to this game, a cross-country trip.

Alabama arrives with a 2-hour body clock disadvantage.

Indiana won by 35 in a dominant performance.

Indiana covered the spread comfortably.

The total went Under by 5.5 points.

How do Alabama and Indiana compare on power ratings?

Blue Chip Analytics power ratings favour Indiana (33.7) over Alabama (30.2) by 3.5 points on a neutral field. After adding home field advantage, the rating-implied line may differ meaningfully from the market spread. Indiana brings a neutral home environment to this matchup (Blue Chip HFA: 0.0). Add this to the neutral-site differential to arrive at a venue-adjusted line.

Blue Chip Analytics power ratings represent expected point margin against an average FBS opponent on a neutral field, calculated from game data sourced via CollegeFootballData.com (CFBD). They are one input: cross-reference with the travel, rest, and weather data above before drawing conclusions.

Sources

Weather

Indiana won and Indiana covered the spread.