UTSA defeated Florida International 57–20 in a dominant performance. UTSA covered by 30.0; Game went Over by 14.5.
Adjust any factor to update your projected line
Positive adjustment = favours home team
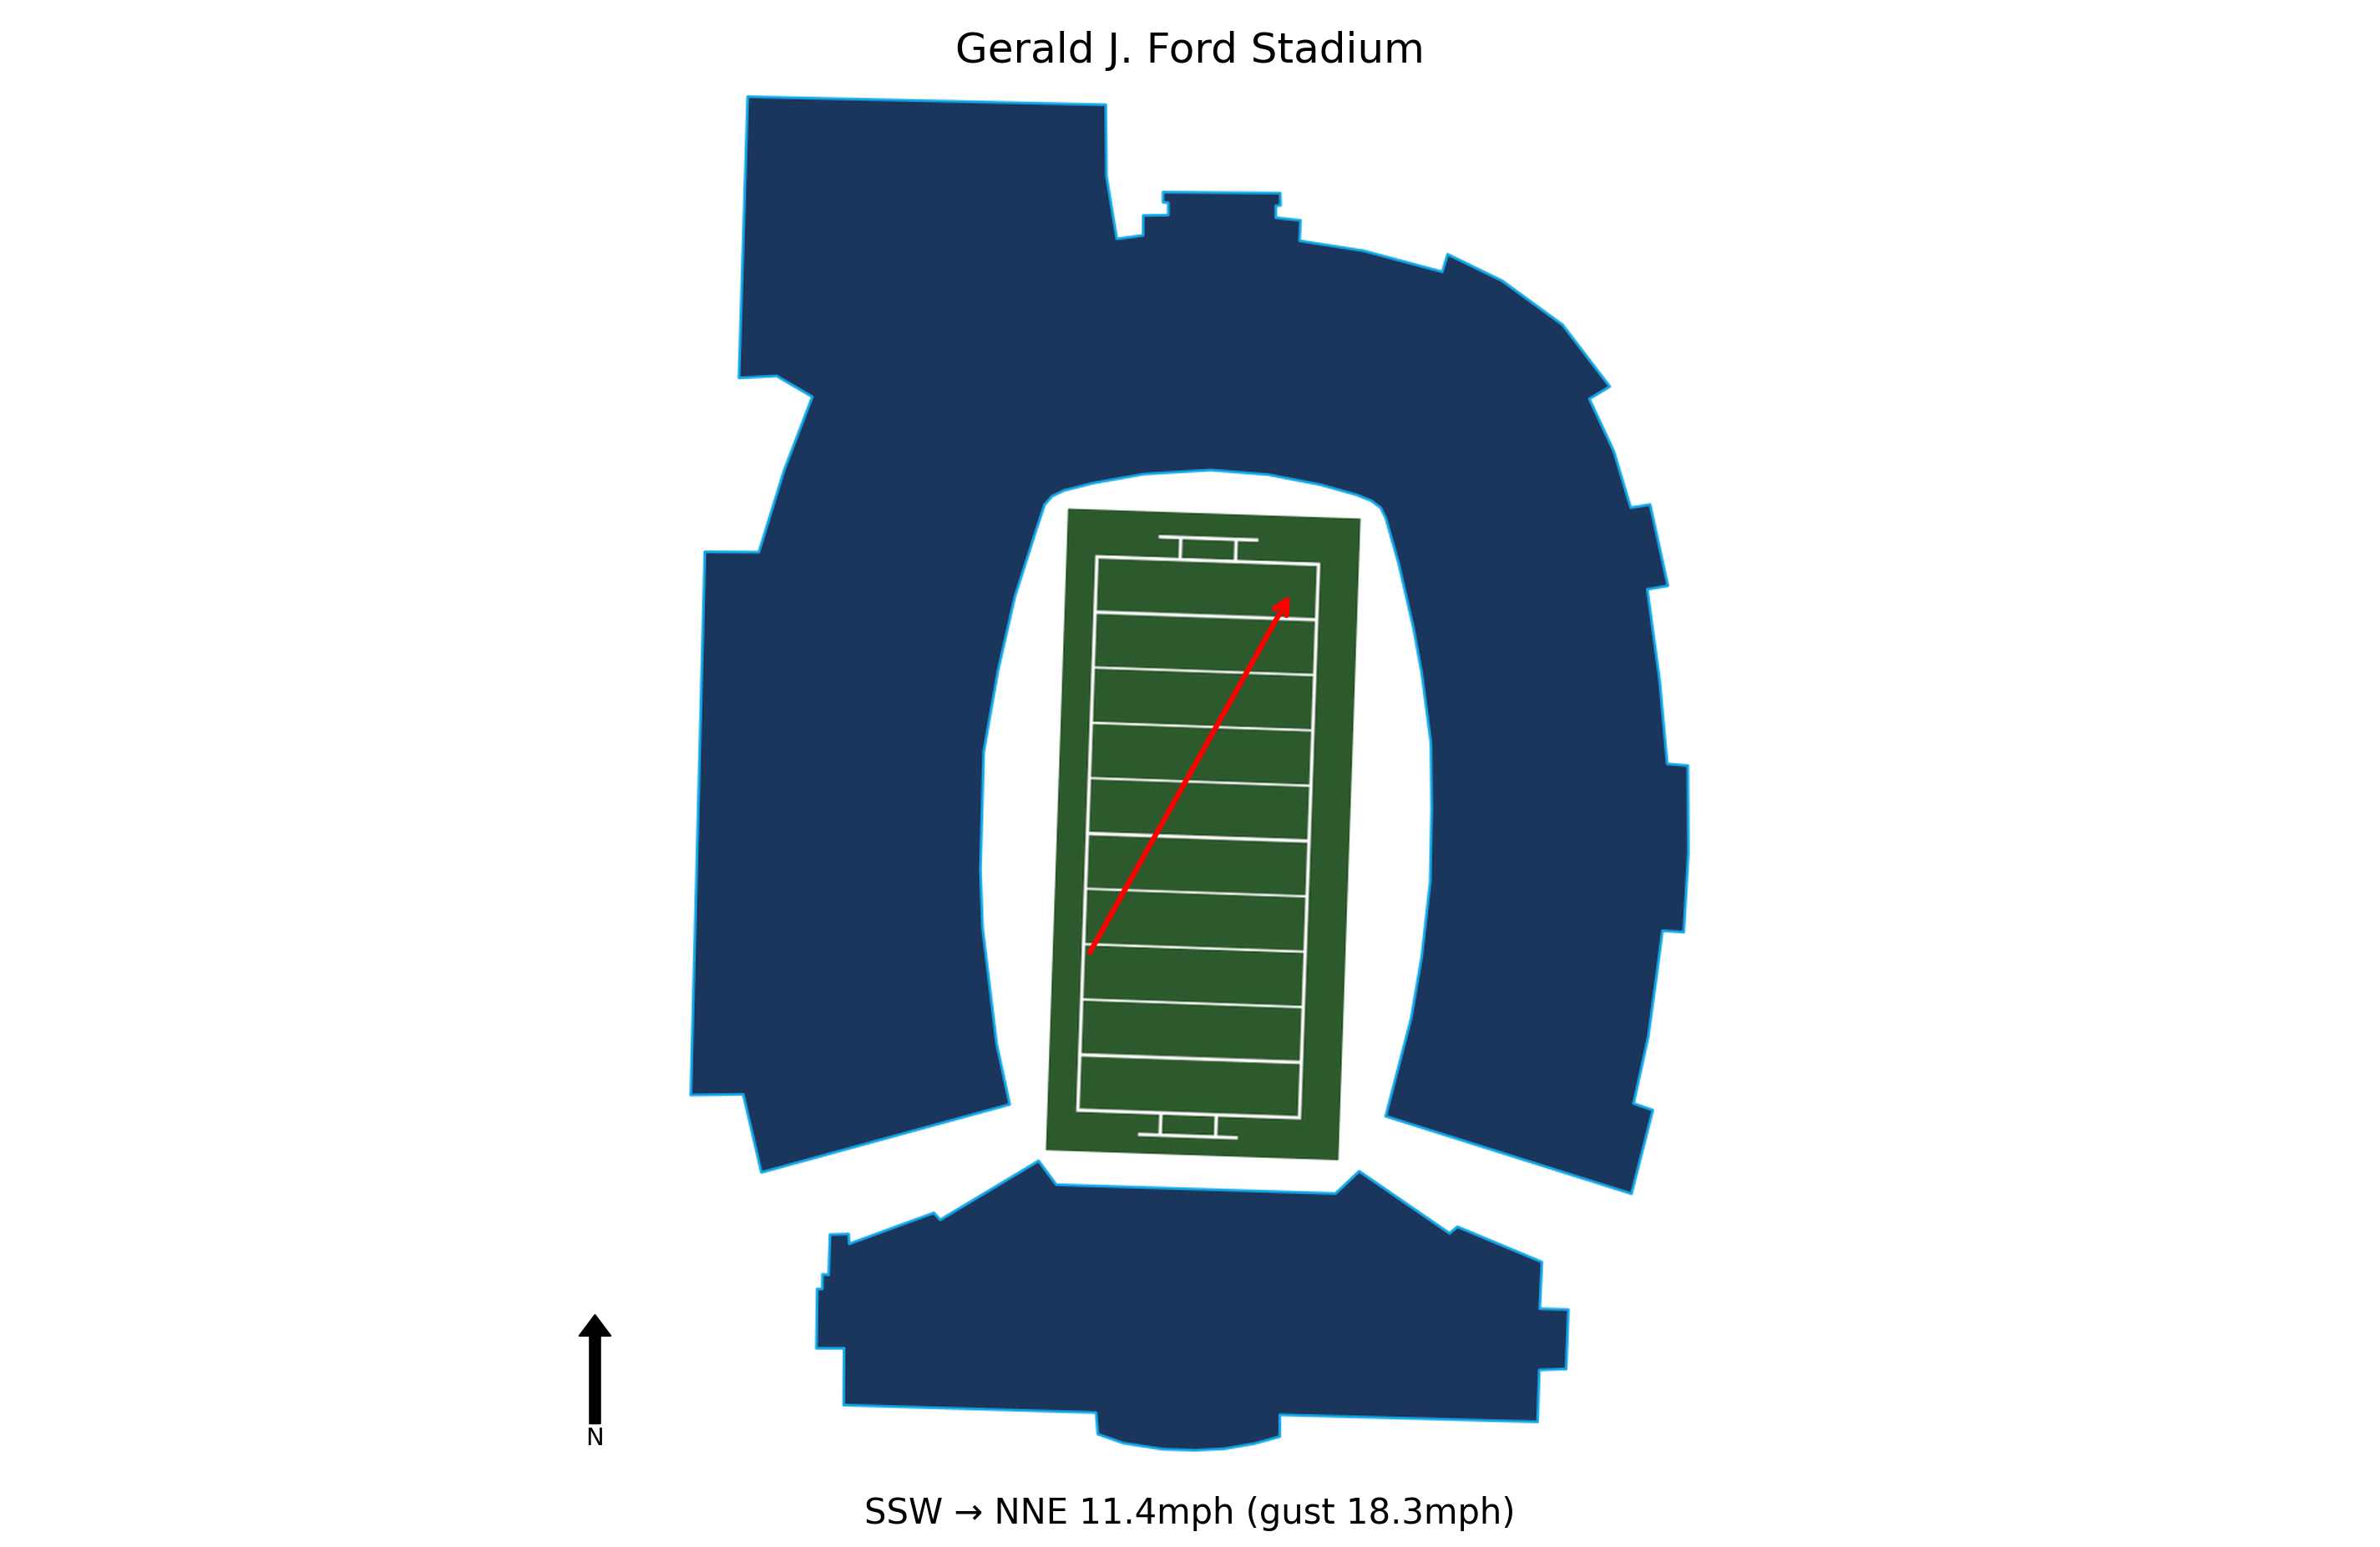
At kick-off, conditions at Gerald J. Ford Stadium were Fog, 63.9°F, Feels Like 63.9°F with winds of 11.4 mph. Weather is not expected to be a meaningful factor in this game. Historical weather data for this game is preserved in the panel below.

63.9°F
Florida International travels 1,102 miles to this game, a significant road trip.
Florida International arrives with a 1-hour body clock shift.
UTSA won by 37 in a dominant performance.
UTSA covered the spread comfortably.
The total went Over by 14.5 points.
Blue Chip Analytics power ratings favour UTSA (1.9) over Florida International (-14.2) by 16.1 points on a neutral field. After adding home field advantage, the rating-implied line may differ meaningfully from the market spread. UTSA brings a neutral home environment to this matchup (Blue Chip HFA: 0.0). Add this to the neutral-site differential to arrive at a venue-adjusted line.
Blue Chip Analytics power ratings represent expected point margin against an average FBS opponent on a neutral field, calculated from game data sourced via CollegeFootballData.com (CFBD). They are one input: cross-reference with the travel, rest, and weather data above before drawing conclusions.
UTSA won and UTSA covered the spread.


