Stanford defeated Florida State 20–13 in a one-score game. Stanford covered by 24.5; Game went Under by 22.5. Blue Chip Analytics had rated Florida State 18.2 points stronger on a neutral field.
Adjust any factor to update your projected line
Positive adjustment = favours home team
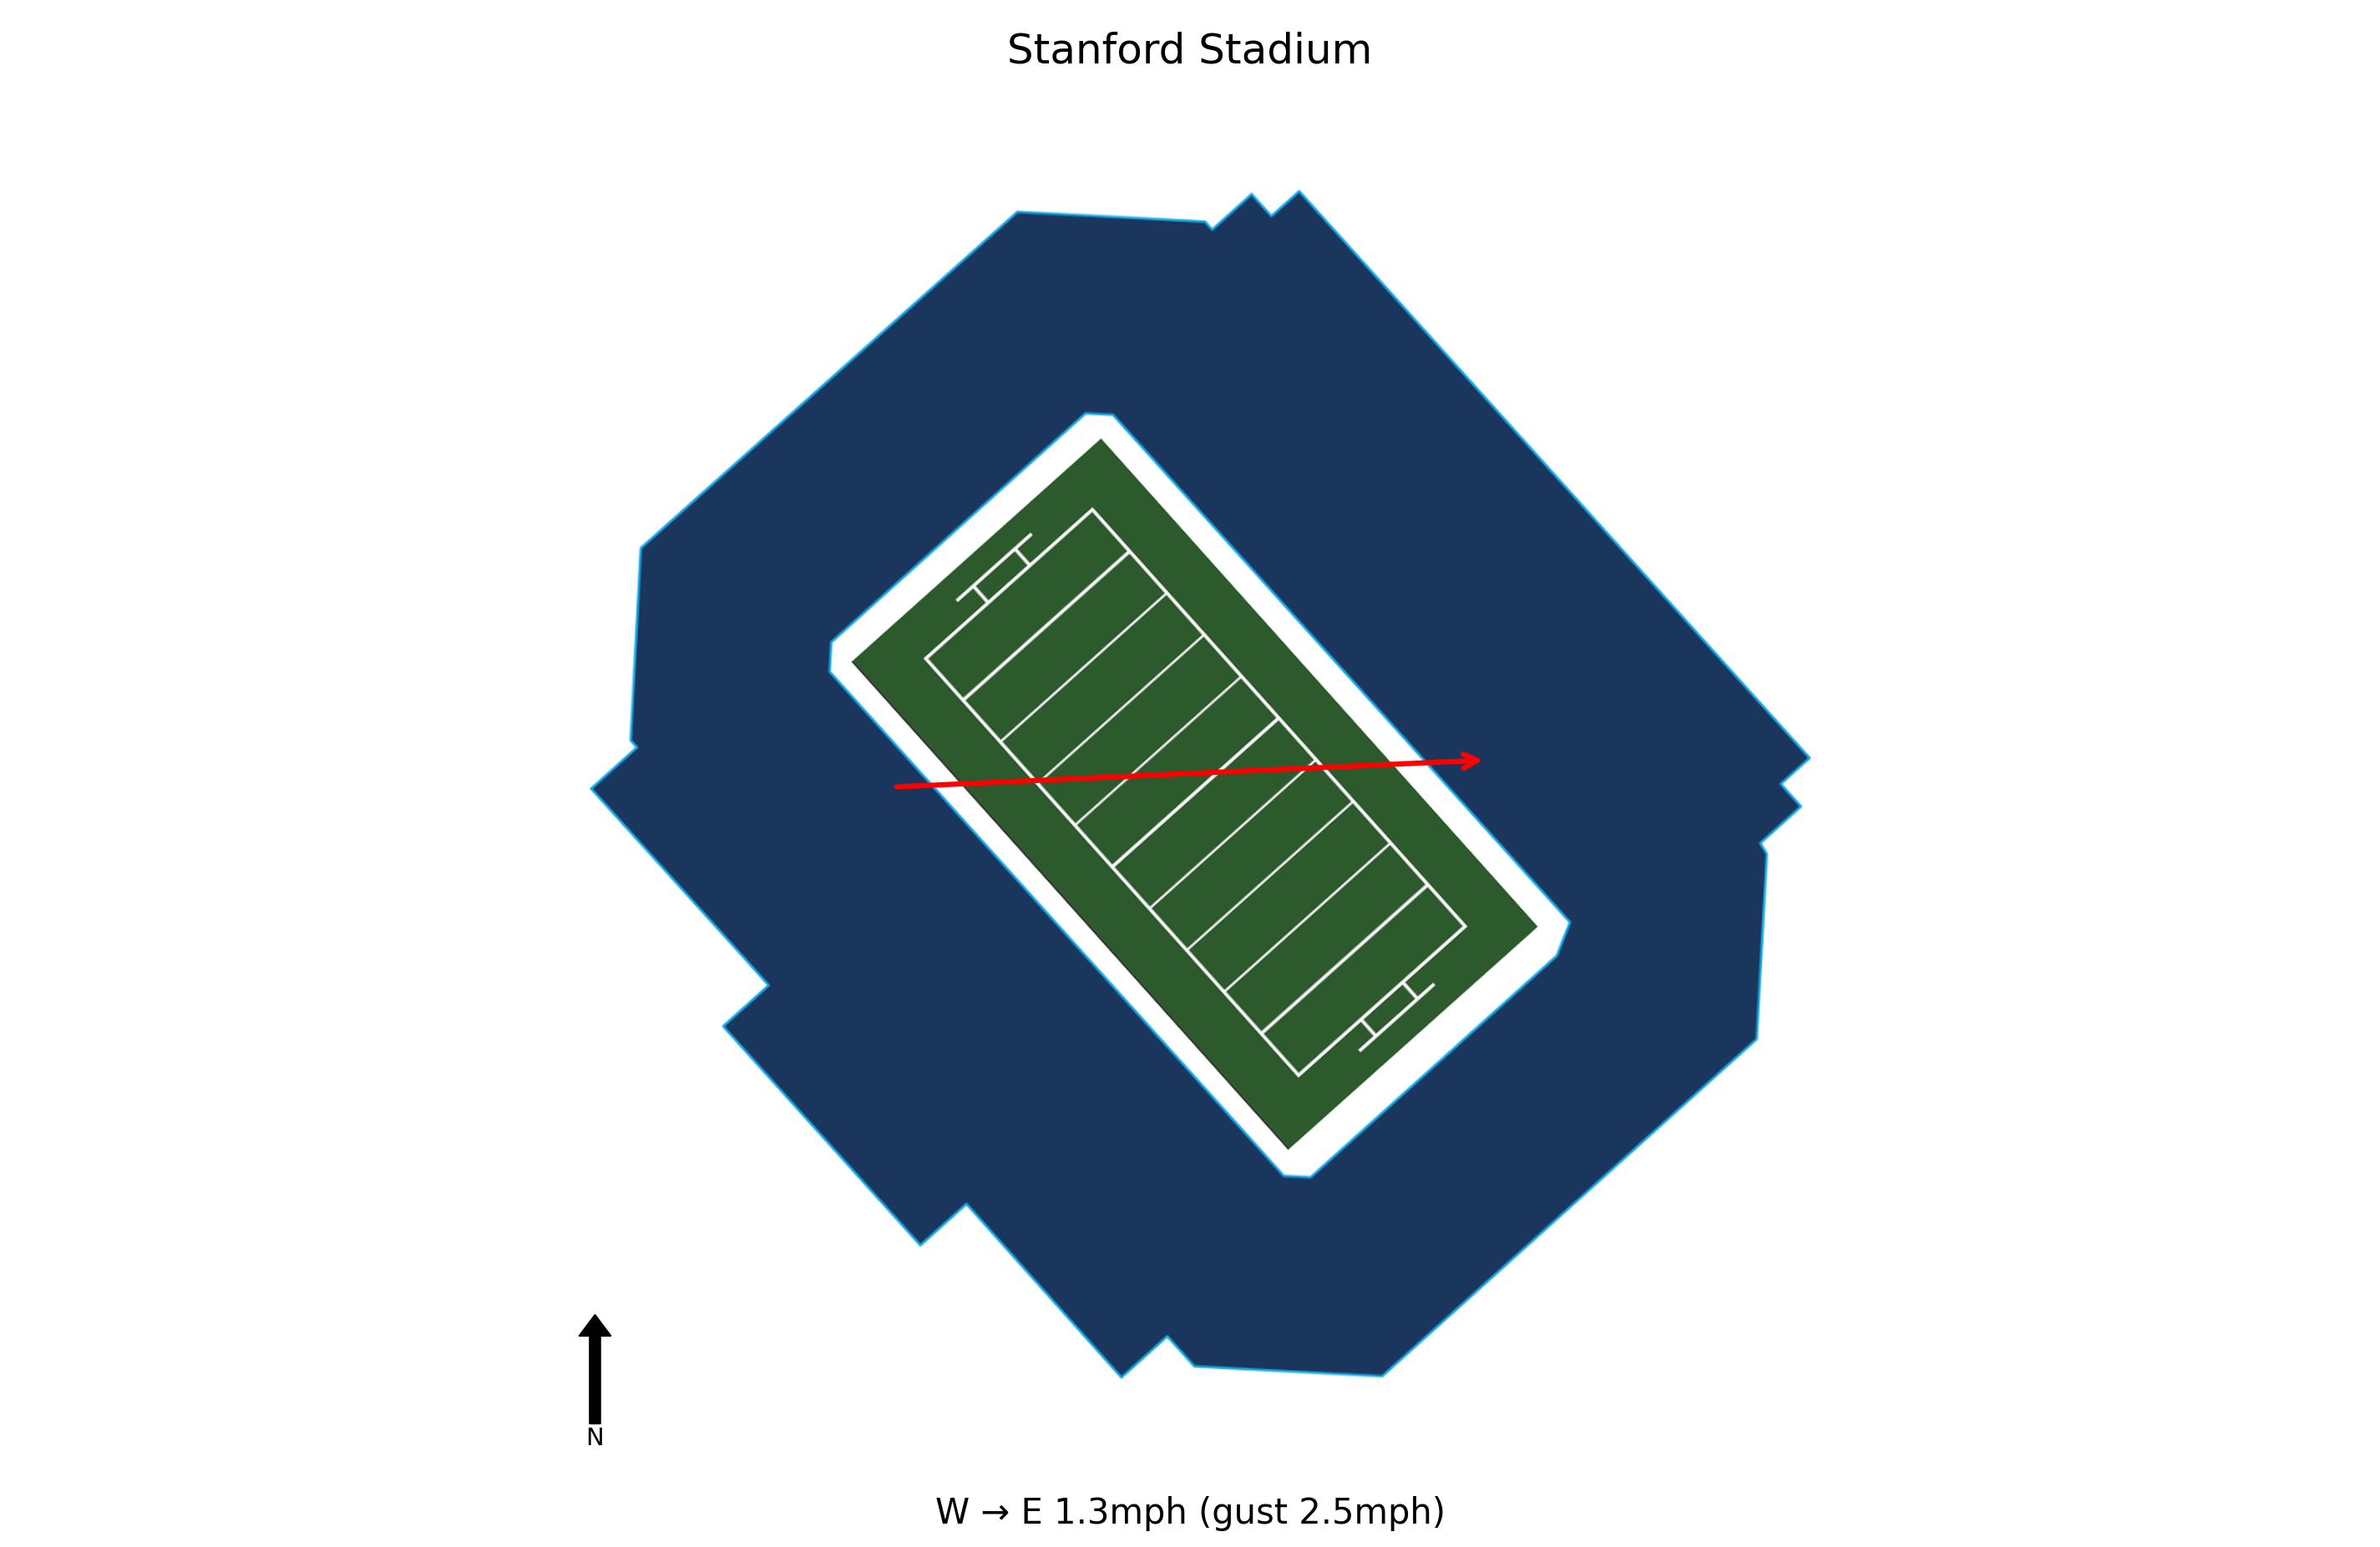
At kick-off, conditions at Stanford Stadium were Clear, 58.5°F, Feels Like 59.4°F with winds of 1.3 mph. Weather is not expected to be a meaningful factor in this game. Historical weather data for this game is preserved in the panel below.

58.5°F
Florida State committed critical penalties, including a delay of game before the first snap, another before a missed field goal, and an offsides on a fourth-and-1 hard count. These mistakes contributed to their inability to sustain drives and score consistently.
Despite a valiant comeback attempt, including a 49-yard desperation pass and a pass interference call that set up an untimed down from the 2-yard line, the Seminoles failed to convert on the final play, with Gavin Sawchuk being stopped just short of the goal line.
Starter Tommy Castellanos was knocked out of the game due to a targeting foul, forcing backup Kevin Sperry into action. Sperry nearly led a game-winning drive but the offense could not finish, highlighting depth concerns at quarterback.
The defense allowed a 13-play, 94-yard touchdown drive in the third quarter and committed a costly offsides penalty on a missed field goal that turned into a Stanford touchdown. These breakdowns put the offense in a constant hole.
The loss extends Florida State's ACC losing streak to nine games, and the team's frustration was evident in sideline exchanges. This lack of confidence and discipline could hinder their preparation for Wake Forest on Nov. 1.
Florida State travels 2,212 miles to this game, a cross-country trip.
Florida State arrives with a 3-hour body clock disadvantage.
Stanford won by 7 in a one-score game.
Stanford covered the spread comfortably.
The total went Under by 22.5 points.
Blue Chip Analytics power ratings favour Florida State (15.8) over Stanford (-2.4) by 18.2 points on a neutral field. Despite playing at home, Stanford faces a power rating deficit. Check whether the market spread accounts for this gap. Stanford brings a modest home field advantage to this matchup (Blue Chip HFA: 1.8). Add this to the neutral-site differential to arrive at a venue-adjusted line.
Blue Chip Analytics power ratings represent expected point margin against an average FBS opponent on a neutral field, calculated from game data sourced via CollegeFootballData.com (CFBD). They are one input: cross-reference with the travel, rest, and weather data above before drawing conclusions.
Stanford won and Stanford covered the spread.


