UTSA defeated Tulane 48–26 to secure a comfortable win. UTSA covered by 28.0; Game went Over by 19.5.
Adjust any factor to update your projected line
Positive adjustment = favours home team
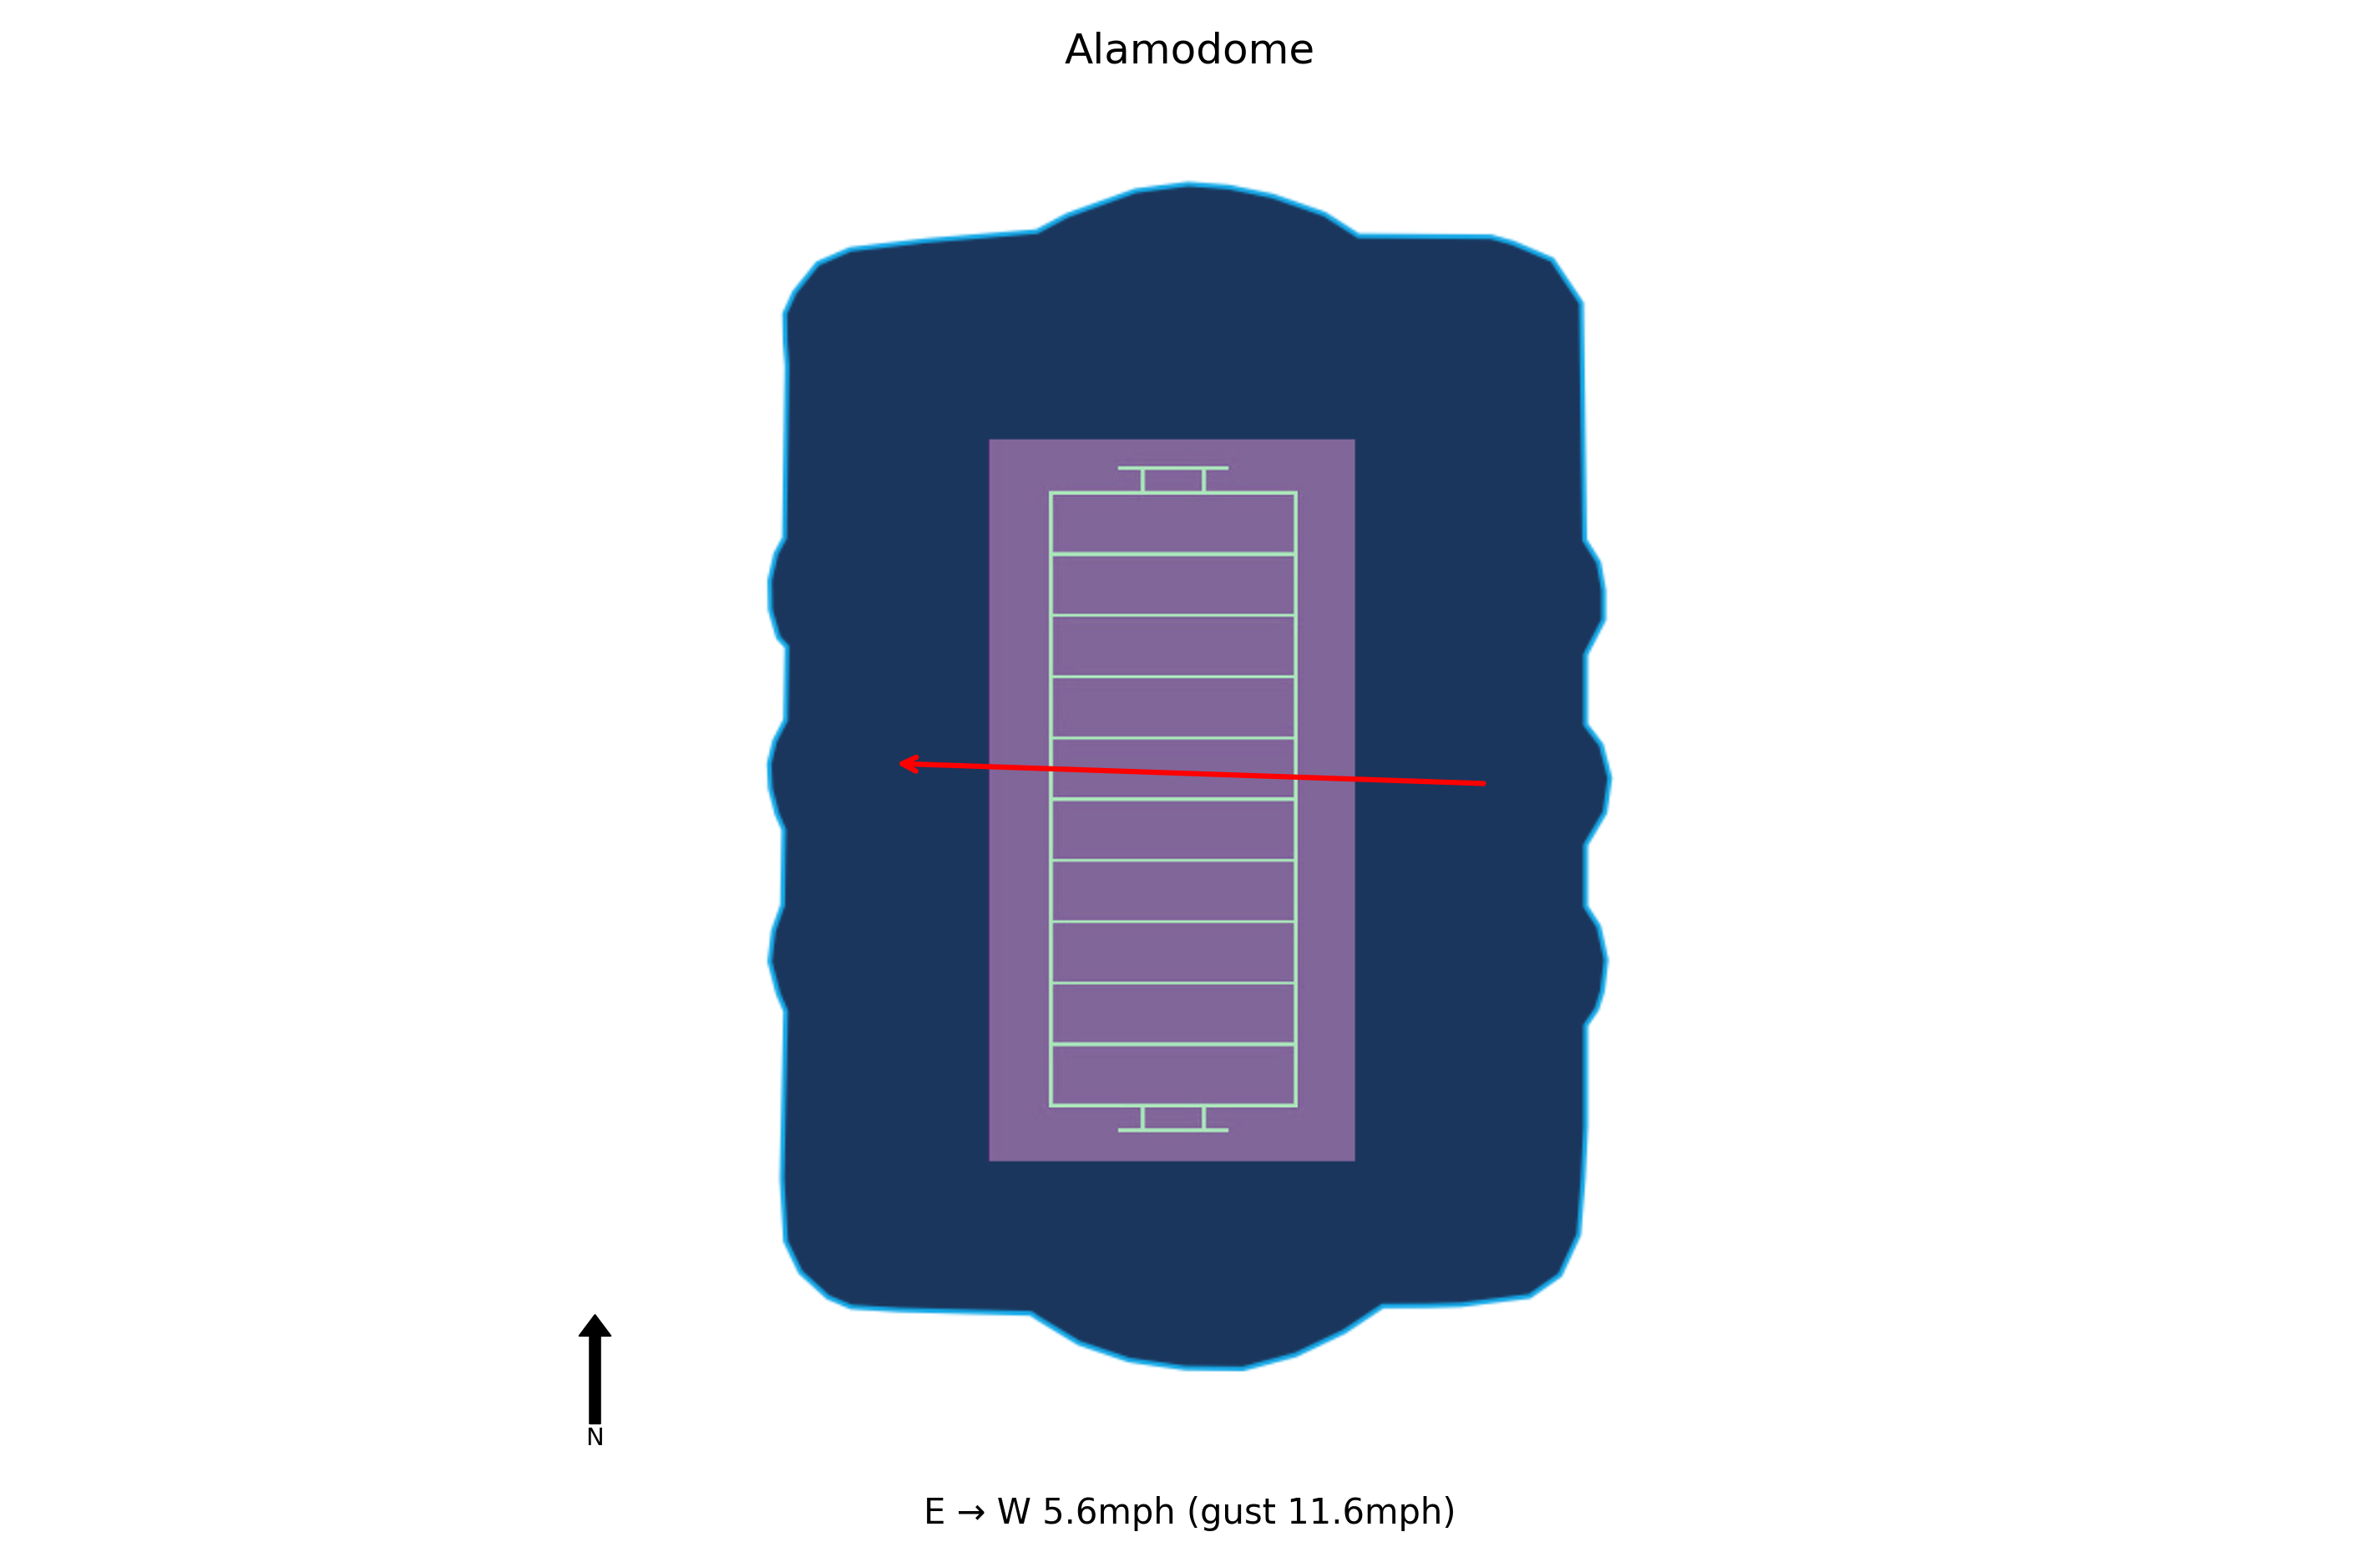
This game was played indoors at Alamodome in a climate-controlled environment. Weather was not a factor.
~72°F
Tulane committed four turnovers (three interceptions, one fumble) which directly led to UTSA's 31 unanswered points in the first half. This was a critical factor in the loss and a major concern moving forward.
After an impressive 75-yard scoring drive to open the game, Tulane's offense stalled and allowed UTSA to score 31 straight points. The inability to sustain momentum after the initial drive was a key issue.
Jake Retzlaff threw for a touchdown and ran for another, but also threw two interceptions. Backup Brendan Sullivan added another interception, highlighting instability at the quarterback position.
Tulane's defense allowed UTSA quarterback Owen McCown to complete 31 of 33 passes for 370 yards and four touchdowns, with two receivers each catching two touchdowns. The secondary was unable to contain the Roadrunners' passing attack.
The loss ended Tulane's three-game winning streak and dropped them to 3-1 in conference play. The team will need to regroup quickly to stay competitive in the American Conference race.
Owen McCown completed 31 of 33 passes for 370 yards and 4 touchdowns, showcasing exceptional efficiency and accuracy. This performance suggests UTSA's passing game is a major strength moving forward.
UTSA won its 22nd straight regular season conference game at home and holds a 32-4 home record under Jeff Traylor. This trend indicates they are very difficult to beat at home, which could be a key factor in future matchups.
David Amador II and Devin McCuin each had two touchdown catches, while Robert Henry Jr. rushed for 87 yards. The offense showed multiple threats, making it hard for defenses to focus on one player.
UTSA forced four turnovers from Tulane, including two interceptions. This ability to create turnovers can swing games and will be crucial in upcoming contests.
Tulane travels 504 miles to this game, a moderate road trip.
UTSA won by 22 to secure a comfortable win.
UTSA covered the spread comfortably.
The total went Over by 19.5 points.
Blue Chip Analytics power ratings favour Tulane (4.1) over UTSA (1.7) by 2.4 points on a neutral field. Despite playing at home, UTSA faces a power rating deficit. Check whether the market spread accounts for this gap. UTSA brings a meaningful home field advantage to this matchup (Blue Chip HFA: 2.9). Add this to the neutral-site differential to arrive at a venue-adjusted line.
Blue Chip Analytics power ratings represent expected point margin against an average FBS opponent on a neutral field, calculated from game data sourced via CollegeFootballData.com (CFBD). They are one input: cross-reference with the travel, rest, and weather data above before drawing conclusions.
UTSA won and UTSA covered the spread.


