Texas A&M defeated LSU 49–25 to secure a comfortable win. Texas A&M covered by 22.5; Game went Over by 23.5.
Adjust any factor to update your projected line
Positive adjustment = favours home team
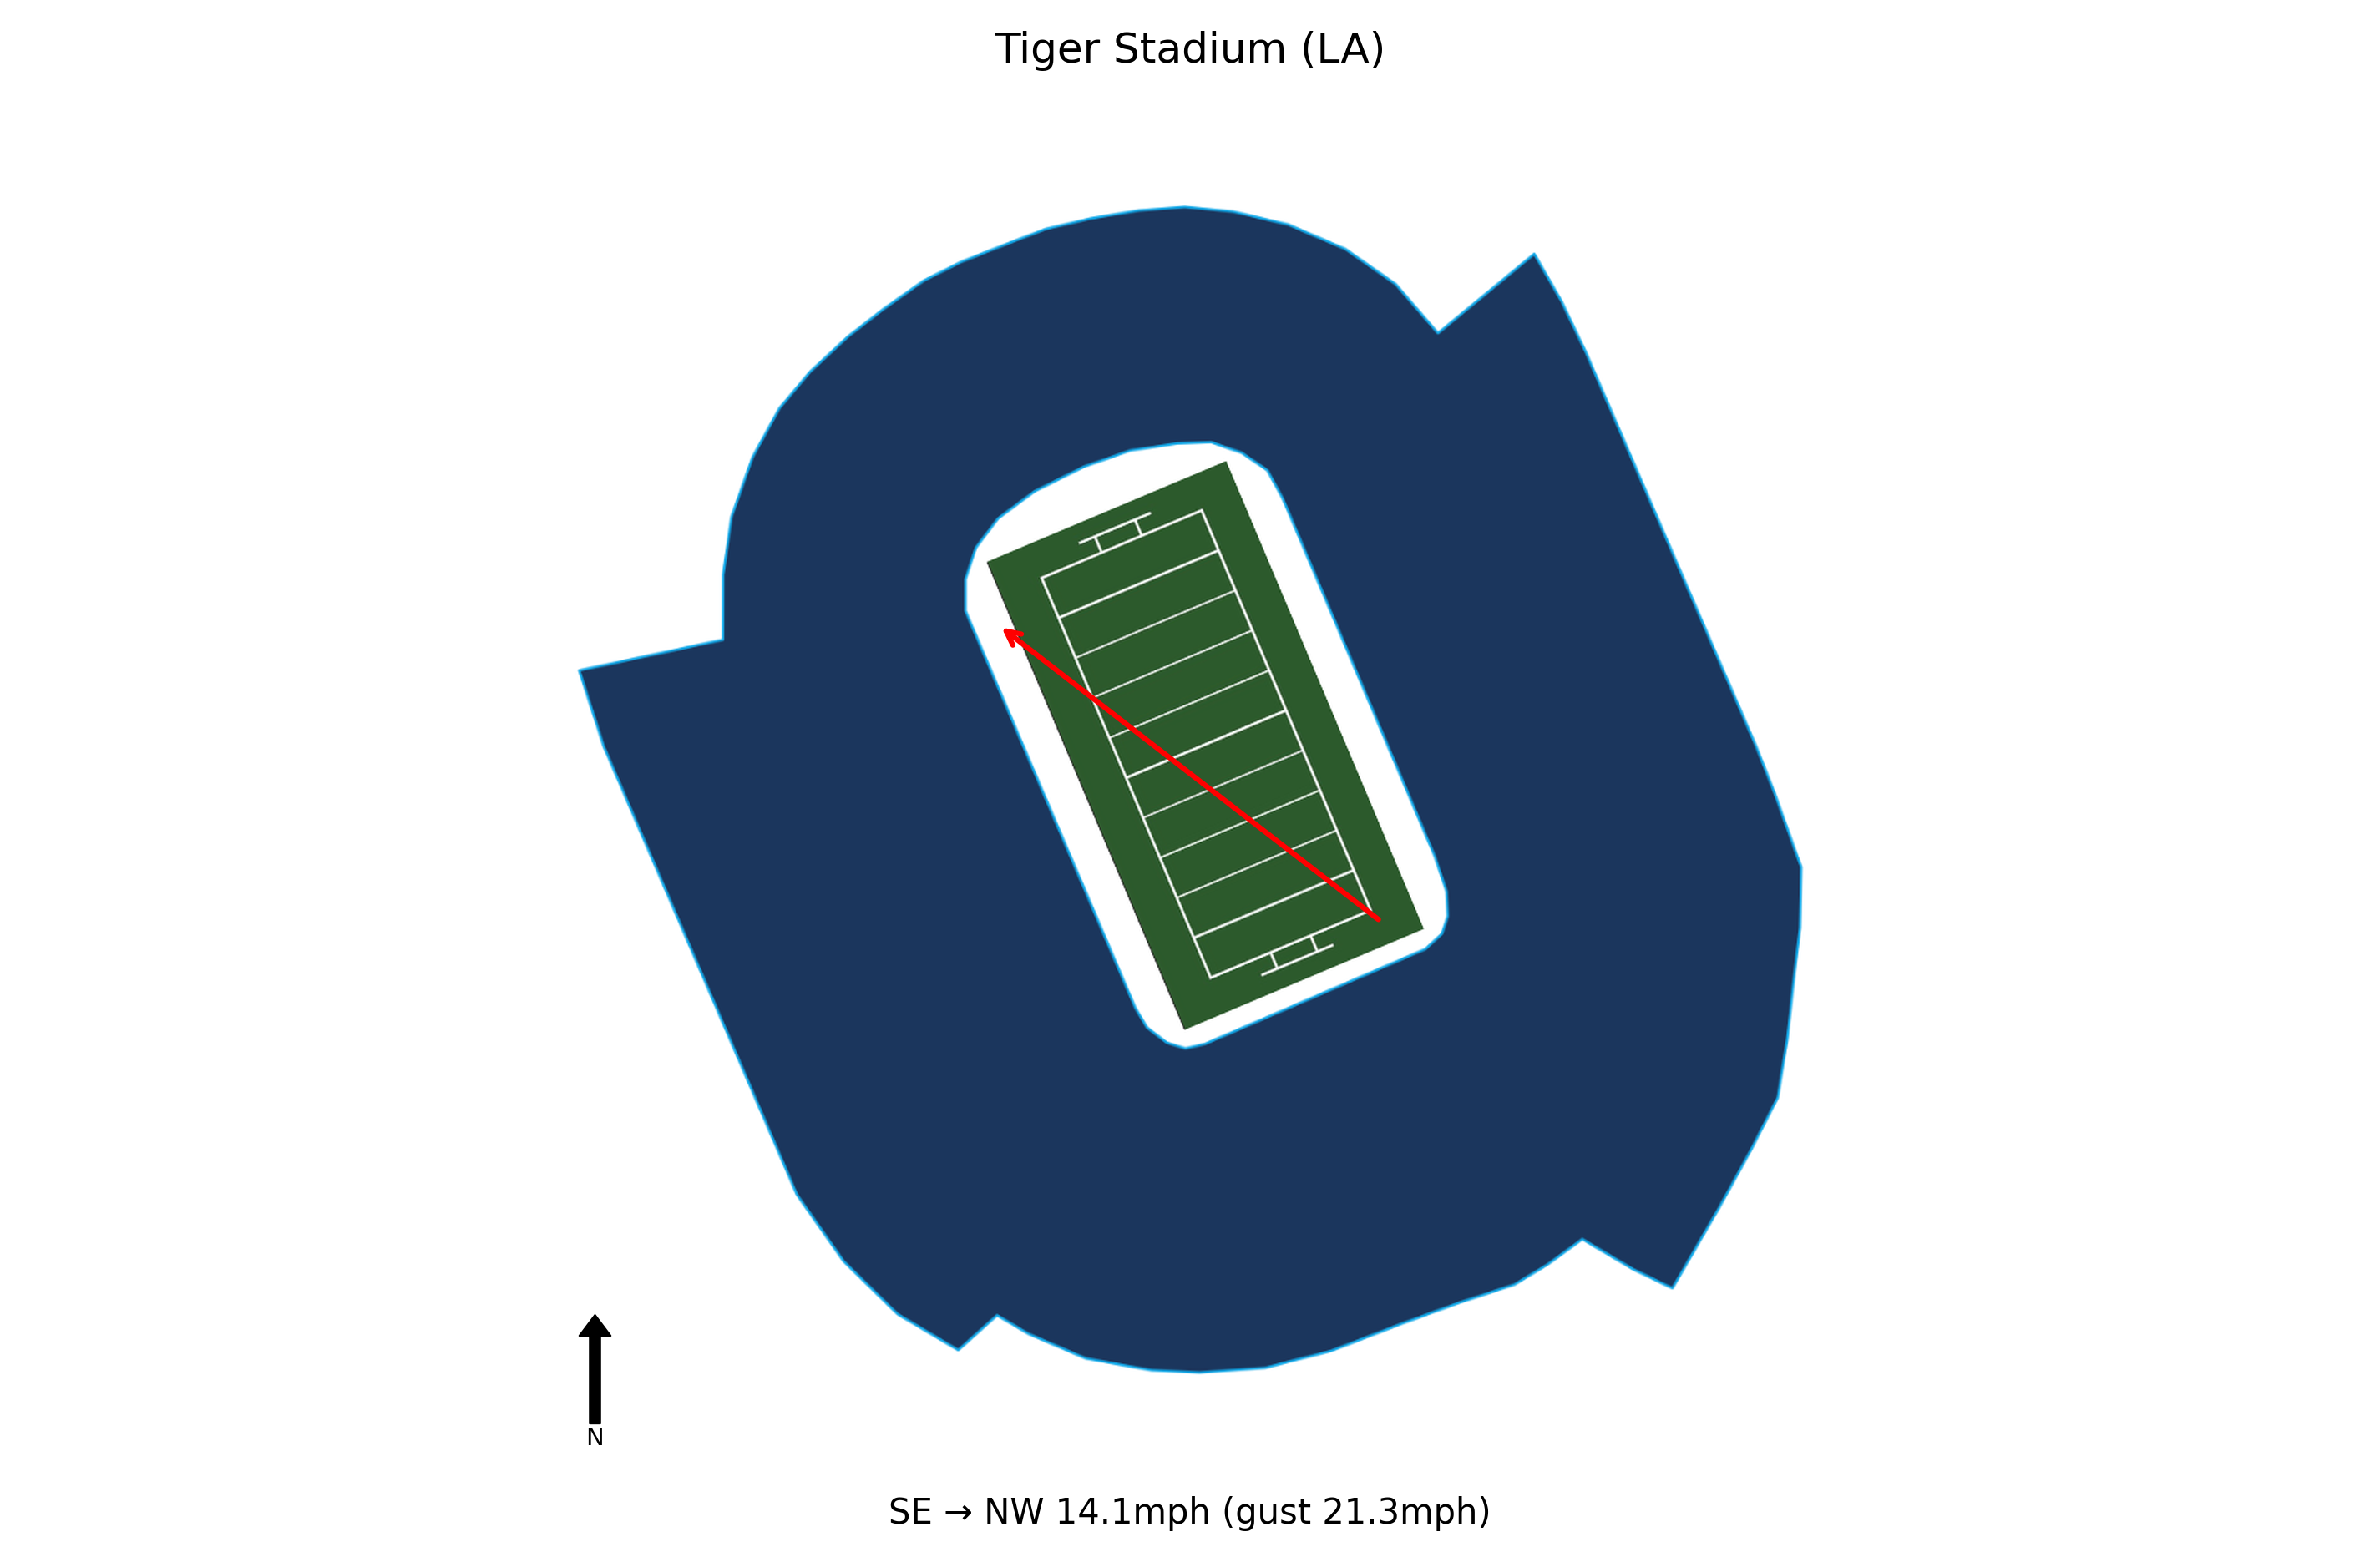
At kick-off, conditions at Tiger Stadium (LA) were Overcast, 71.4°F, Feels Like 71.4°F with winds of 14.1 mph. Gusts reaching 21.3 mph add unpredictability to the passing game. Historical weather data for this game is preserved in the panel below.

71.4°F
Texas A&M travels 308 miles to this game, a short road trip.
Texas A&M won by 24 to secure a comfortable win.
Texas A&M covered the spread comfortably.
The total went Over by 23.5 points.
Gusts reaching 21.3 mph add unpredictability to the passing game.
Full conditions are shown in the data panel above. Forecast data sourced from WeatherAPI.com. Use the Line Value Calculator to apply a manual weather adjustment to your projected line.
Blue Chip Analytics power ratings favour Texas A&M (21.5) over LSU (15.3) by 6.2 points on a neutral field. Despite playing at home, LSU faces a power rating deficit. Check whether the market spread accounts for this gap. LSU brings one of the stronger home environments in the FBS to this matchup (Blue Chip HFA: 3.0). Add this to the neutral-site differential to arrive at a venue-adjusted line.
Blue Chip Analytics power ratings represent expected point margin against an average FBS opponent on a neutral field, calculated from game data sourced via CollegeFootballData.com (CFBD). They are one input: cross-reference with the travel, rest, and weather data above before drawing conclusions.
Texas A&M won and Texas A&M covered the spread.


