TCU defeated West Virginia 23–17 in a closely contested finish. West Virginia covered by 10.5; Game went Under by 15.5.
Adjust any factor to update your projected line
Positive adjustment = favours home team
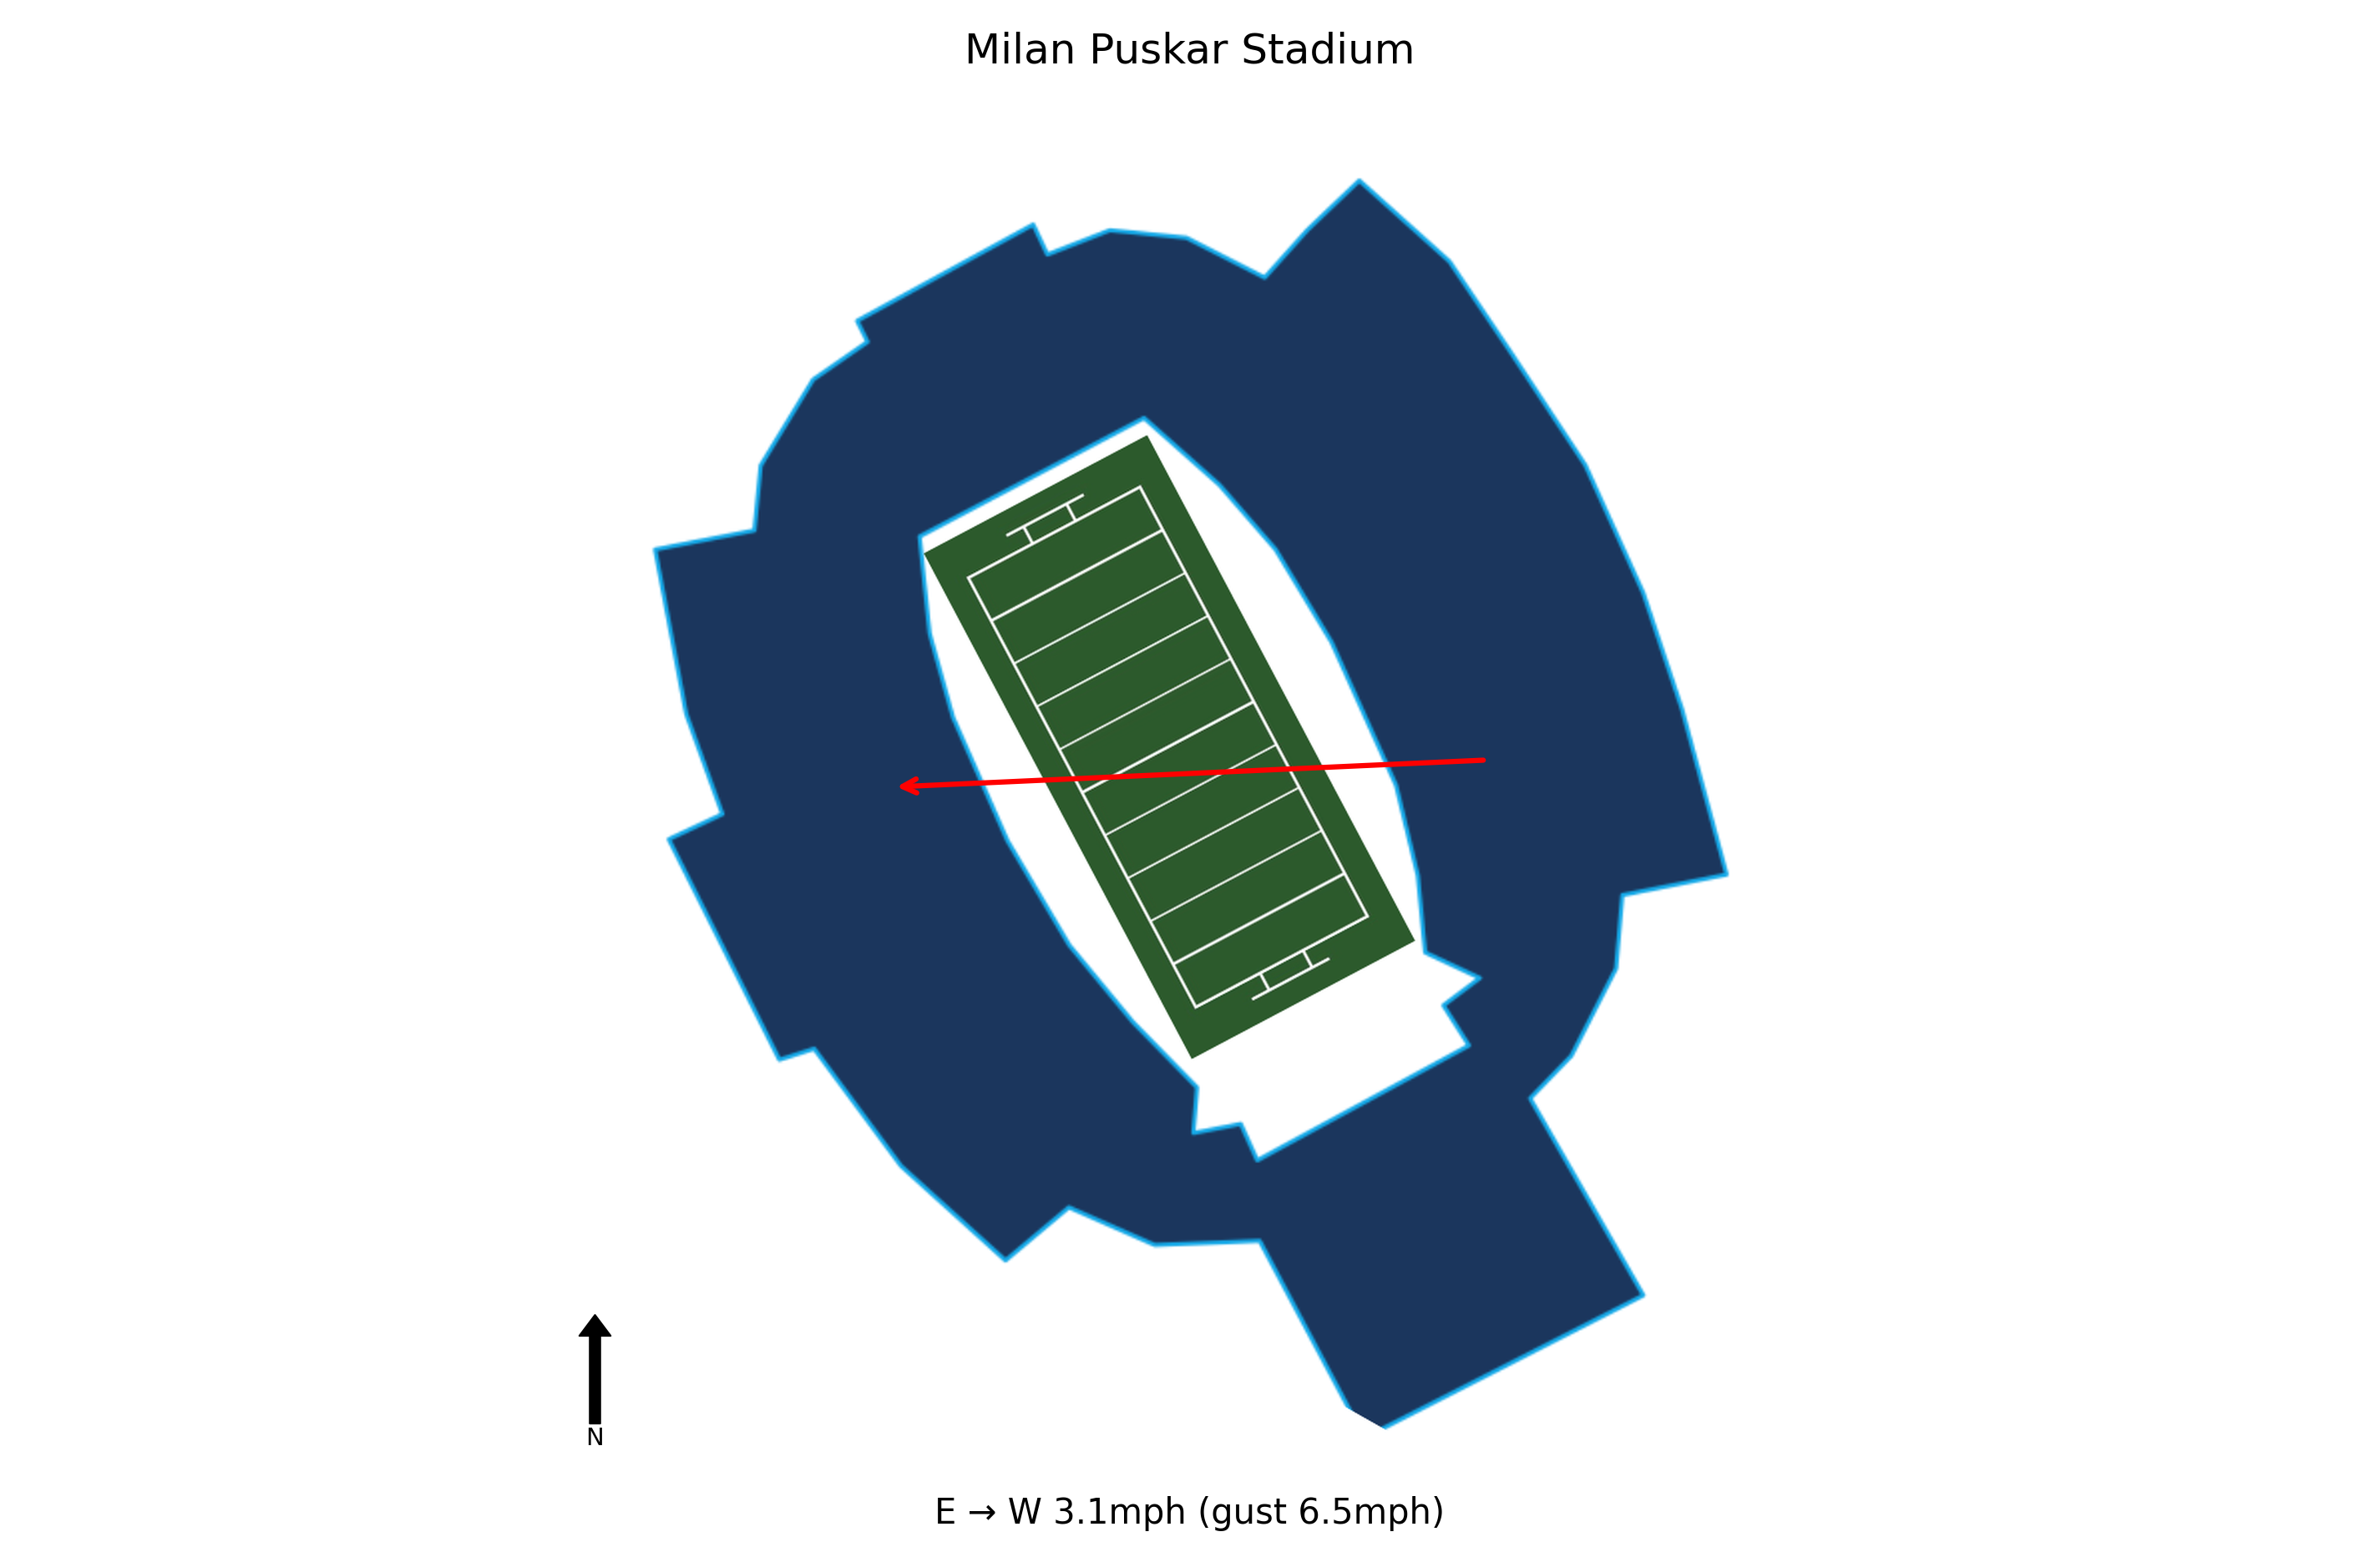
At kick-off, conditions at Milan Puskar Stadium were Cloudy, 45.7°F, Wind Chill 45.1°F with winds of 3.1 mph. Weather is not expected to be a meaningful factor in this game. Historical weather data for this game is preserved in the panel below.

45.7°F
West Virginia has been held to 17 or fewer points in five games this season, including this 23-17 loss. The offense managed only 342 total yards and converted just 2 of 7 fourth-down attempts, highlighting persistent inefficiency.
True freshman Scotty Fox Jr. threw for 301 yards and two touchdowns in his second straight start, marking the first time in over a month the Mountaineers surpassed 150 passing yards. His performance provides a glimmer of hope for the offense.
Despite not committing any turnovers, West Virginia still lost, underscoring that their issues go beyond ball security. The defense allowed TCU to score on short fields and failed to force any takeaways.
At 2-6 overall and 0-5 in Big 12 play, the Mountaineers must win all four remaining games to become bowl eligible. This loss makes that goal extremely difficult, especially with a road game at Houston next.
With 80-some new players on the roster, West Virginia is heading toward its worst season since 2001. The team's lack of experience was evident in critical situations, such as converting only 2 of 7 fourth-down attempts.
TCU travels 1,082 miles to this game, a significant road trip.
TCU arrives with a 1-hour body clock shift.
TCU won by 6 in a closely contested finish.
West Virginia covered the spread by a solid margin.
The total went Under by 15.5 points.
Blue Chip Analytics power ratings favour TCU (14.7) over West Virginia (0.2) by 14.5 points on a neutral field. Despite playing at home, West Virginia faces a power rating deficit. Check whether the market spread accounts for this gap. West Virginia brings a meaningful home field advantage to this matchup (Blue Chip HFA: 2.6). Add this to the neutral-site differential to arrive at a venue-adjusted line.
Blue Chip Analytics power ratings represent expected point margin against an average FBS opponent on a neutral field, calculated from game data sourced via CollegeFootballData.com (CFBD). They are one input: cross-reference with the travel, rest, and weather data above before drawing conclusions.
TCU won and West Virginia covered the spread.


