Oregon defeated Rutgers 56–10 in a dominant performance. Oregon covered by 28.5; Game went Over by 3.5.
Adjust any factor to update your projected line
Positive adjustment = favours home team
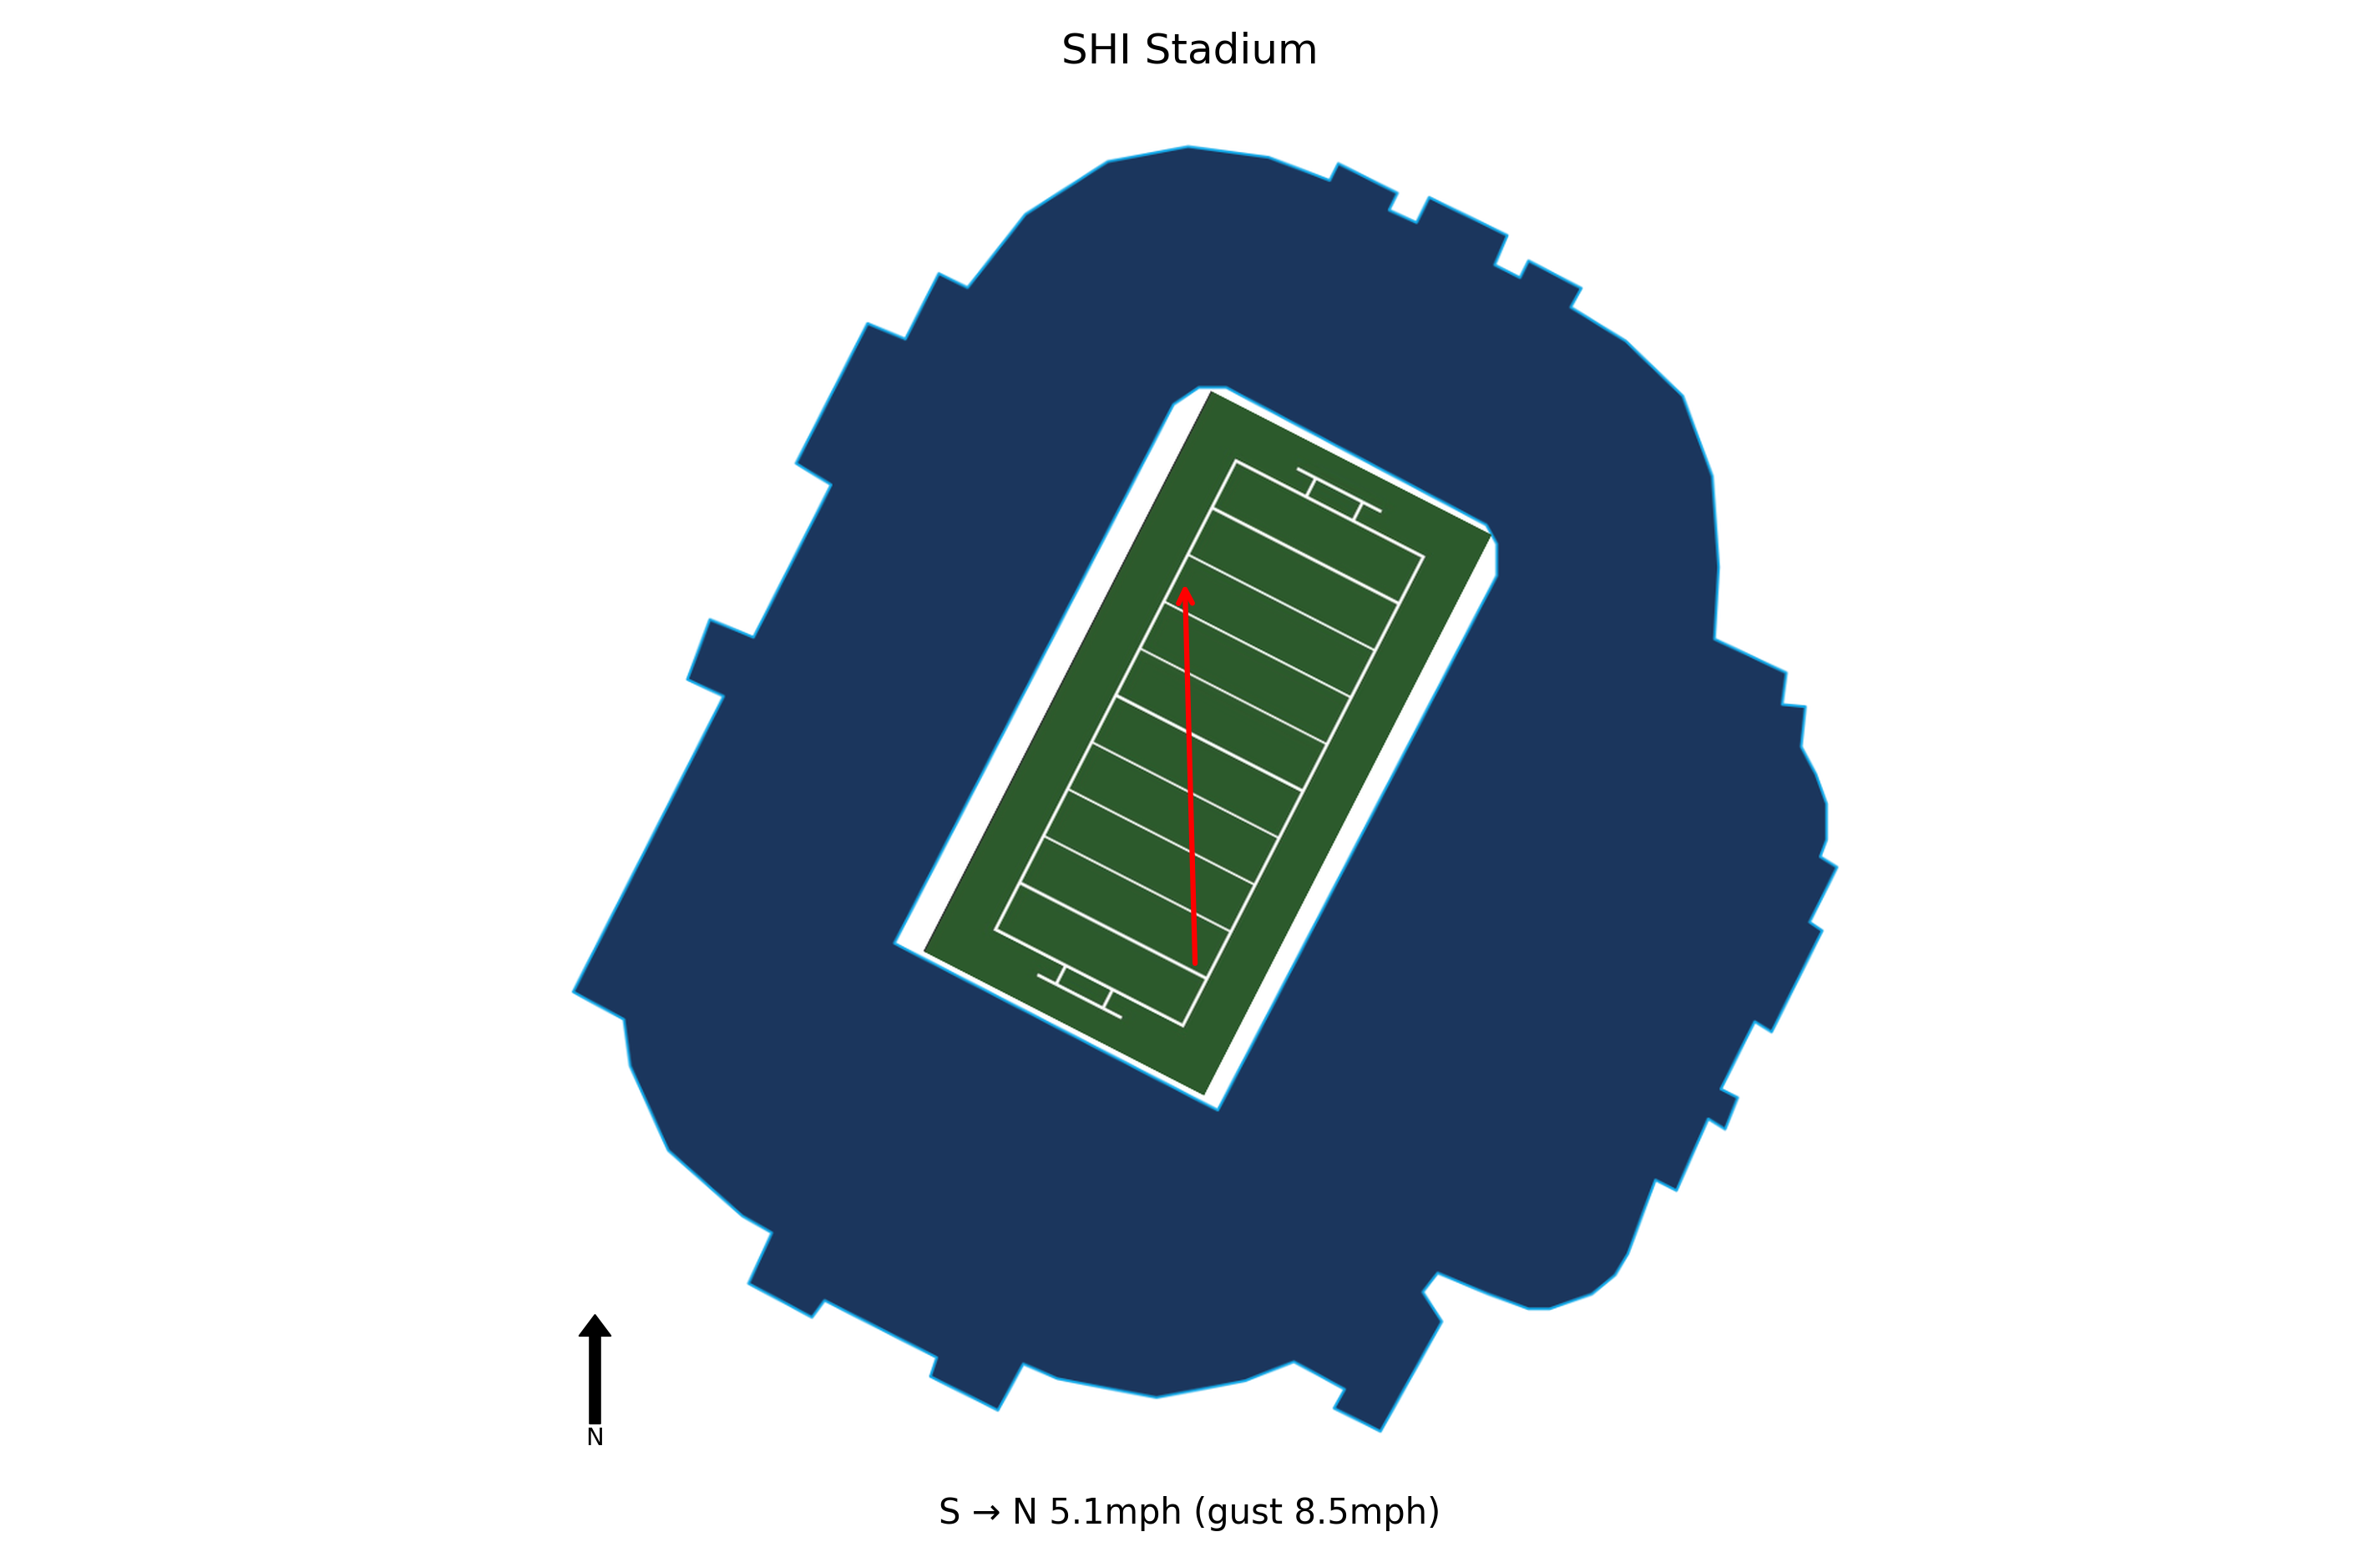
At kick-off, conditions at SHI Stadium were Partly cloudy, 55.0°F, Wind Chill 54.3°F with winds of 5.1 mph. Weather is not expected to be a meaningful factor in this game. Historical weather data for this game is preserved in the panel below.

55.0°F
After a loss to Indiana, Oregon responded with a 56-10 rout of Rutgers, showcasing their ability to rebound and maintain focus. The team extended the nation's longest road winning streak to 10 games, indicating strong mental resilience.
Oregon amassed 750 total yards (415 rushing, 335 passing), the most against a Power 4 school this season. Dante Moore threw for 290 yards and 4 TDs, while Noah Whittington ran for 125 yards and 2 TDs, highlighting a versatile and high-powered offense.
The defense held Rutgers to 202 total yards, sacked the quarterback 3 times, and forced 2 interceptions. Freshman Aaron Flowers contributed 5 tackles, a forced fumble, and an interception, showing depth and playmaking ability.
Dante Moore completed 15 of 20 passes for 290 yards and 4 TDs, playing with joy and executing the game plan at a high level. His performance suggests he has regained confidence after a sub-par outing against Indiana.
Oregon hosts Wisconsin on Oct. 25. The Ducks will look to continue their offensive momentum and defensive pressure against a Badgers team that may struggle to keep up with Oregon's explosive attack.
Rutgers managed only 202 total yards, with quarterback Athan Kaliakmanis completing 8 of 25 passes for 79 yards, two interceptions, and three sacks, highlighting a severe offensive inefficiency.
The defense allowed 750 total yards (415 rushing, 335 passing) and eight plays of 30+ yards, the most yards against a Power 4 school this season, indicating a lack of ability to stop explosive plays.
Rutgers fell to 0-4 in conference play and 3-4 overall, putting their streak of consecutive bowl bids in jeopardy and making a postseason appearance uncertain.
The Scarlet Knights have not beaten a ranked team in 16 years, the longest active streak in college football, underscoring a persistent inability to compete with top-tier opponents.
Freshman defensive back Aaron Flowers recorded five tackles, forced a fumble, and intercepted a pass, providing a rare positive performance in an otherwise lopsided defeat.
Oregon travels 2,467 miles to this game, a cross-country trip.
Oregon arrives with a 3-hour body clock disadvantage.
Oregon won by 46 in a dominant performance.
Oregon covered the spread comfortably.
The total went Over by 3.5 points.
Blue Chip Analytics power ratings favour Oregon (26.3) over Rutgers (4.3) by 22.0 points on a neutral field. Despite playing at home, Rutgers faces a power rating deficit. Check whether the market spread accounts for this gap. Rutgers brings a meaningful home field advantage to this matchup (Blue Chip HFA: 2.1). Add this to the neutral-site differential to arrive at a venue-adjusted line.
Blue Chip Analytics power ratings represent expected point margin against an average FBS opponent on a neutral field, calculated from game data sourced via CollegeFootballData.com (CFBD). They are one input: cross-reference with the travel, rest, and weather data above before drawing conclusions.
Oregon won and Oregon covered the spread.


