Vanderbilt defeated LSU 31–24 in a one-score game. Vanderbilt covered by 5.5; Game went Over by 6.5.
Adjust any factor to update your projected line
Positive adjustment = favours home team
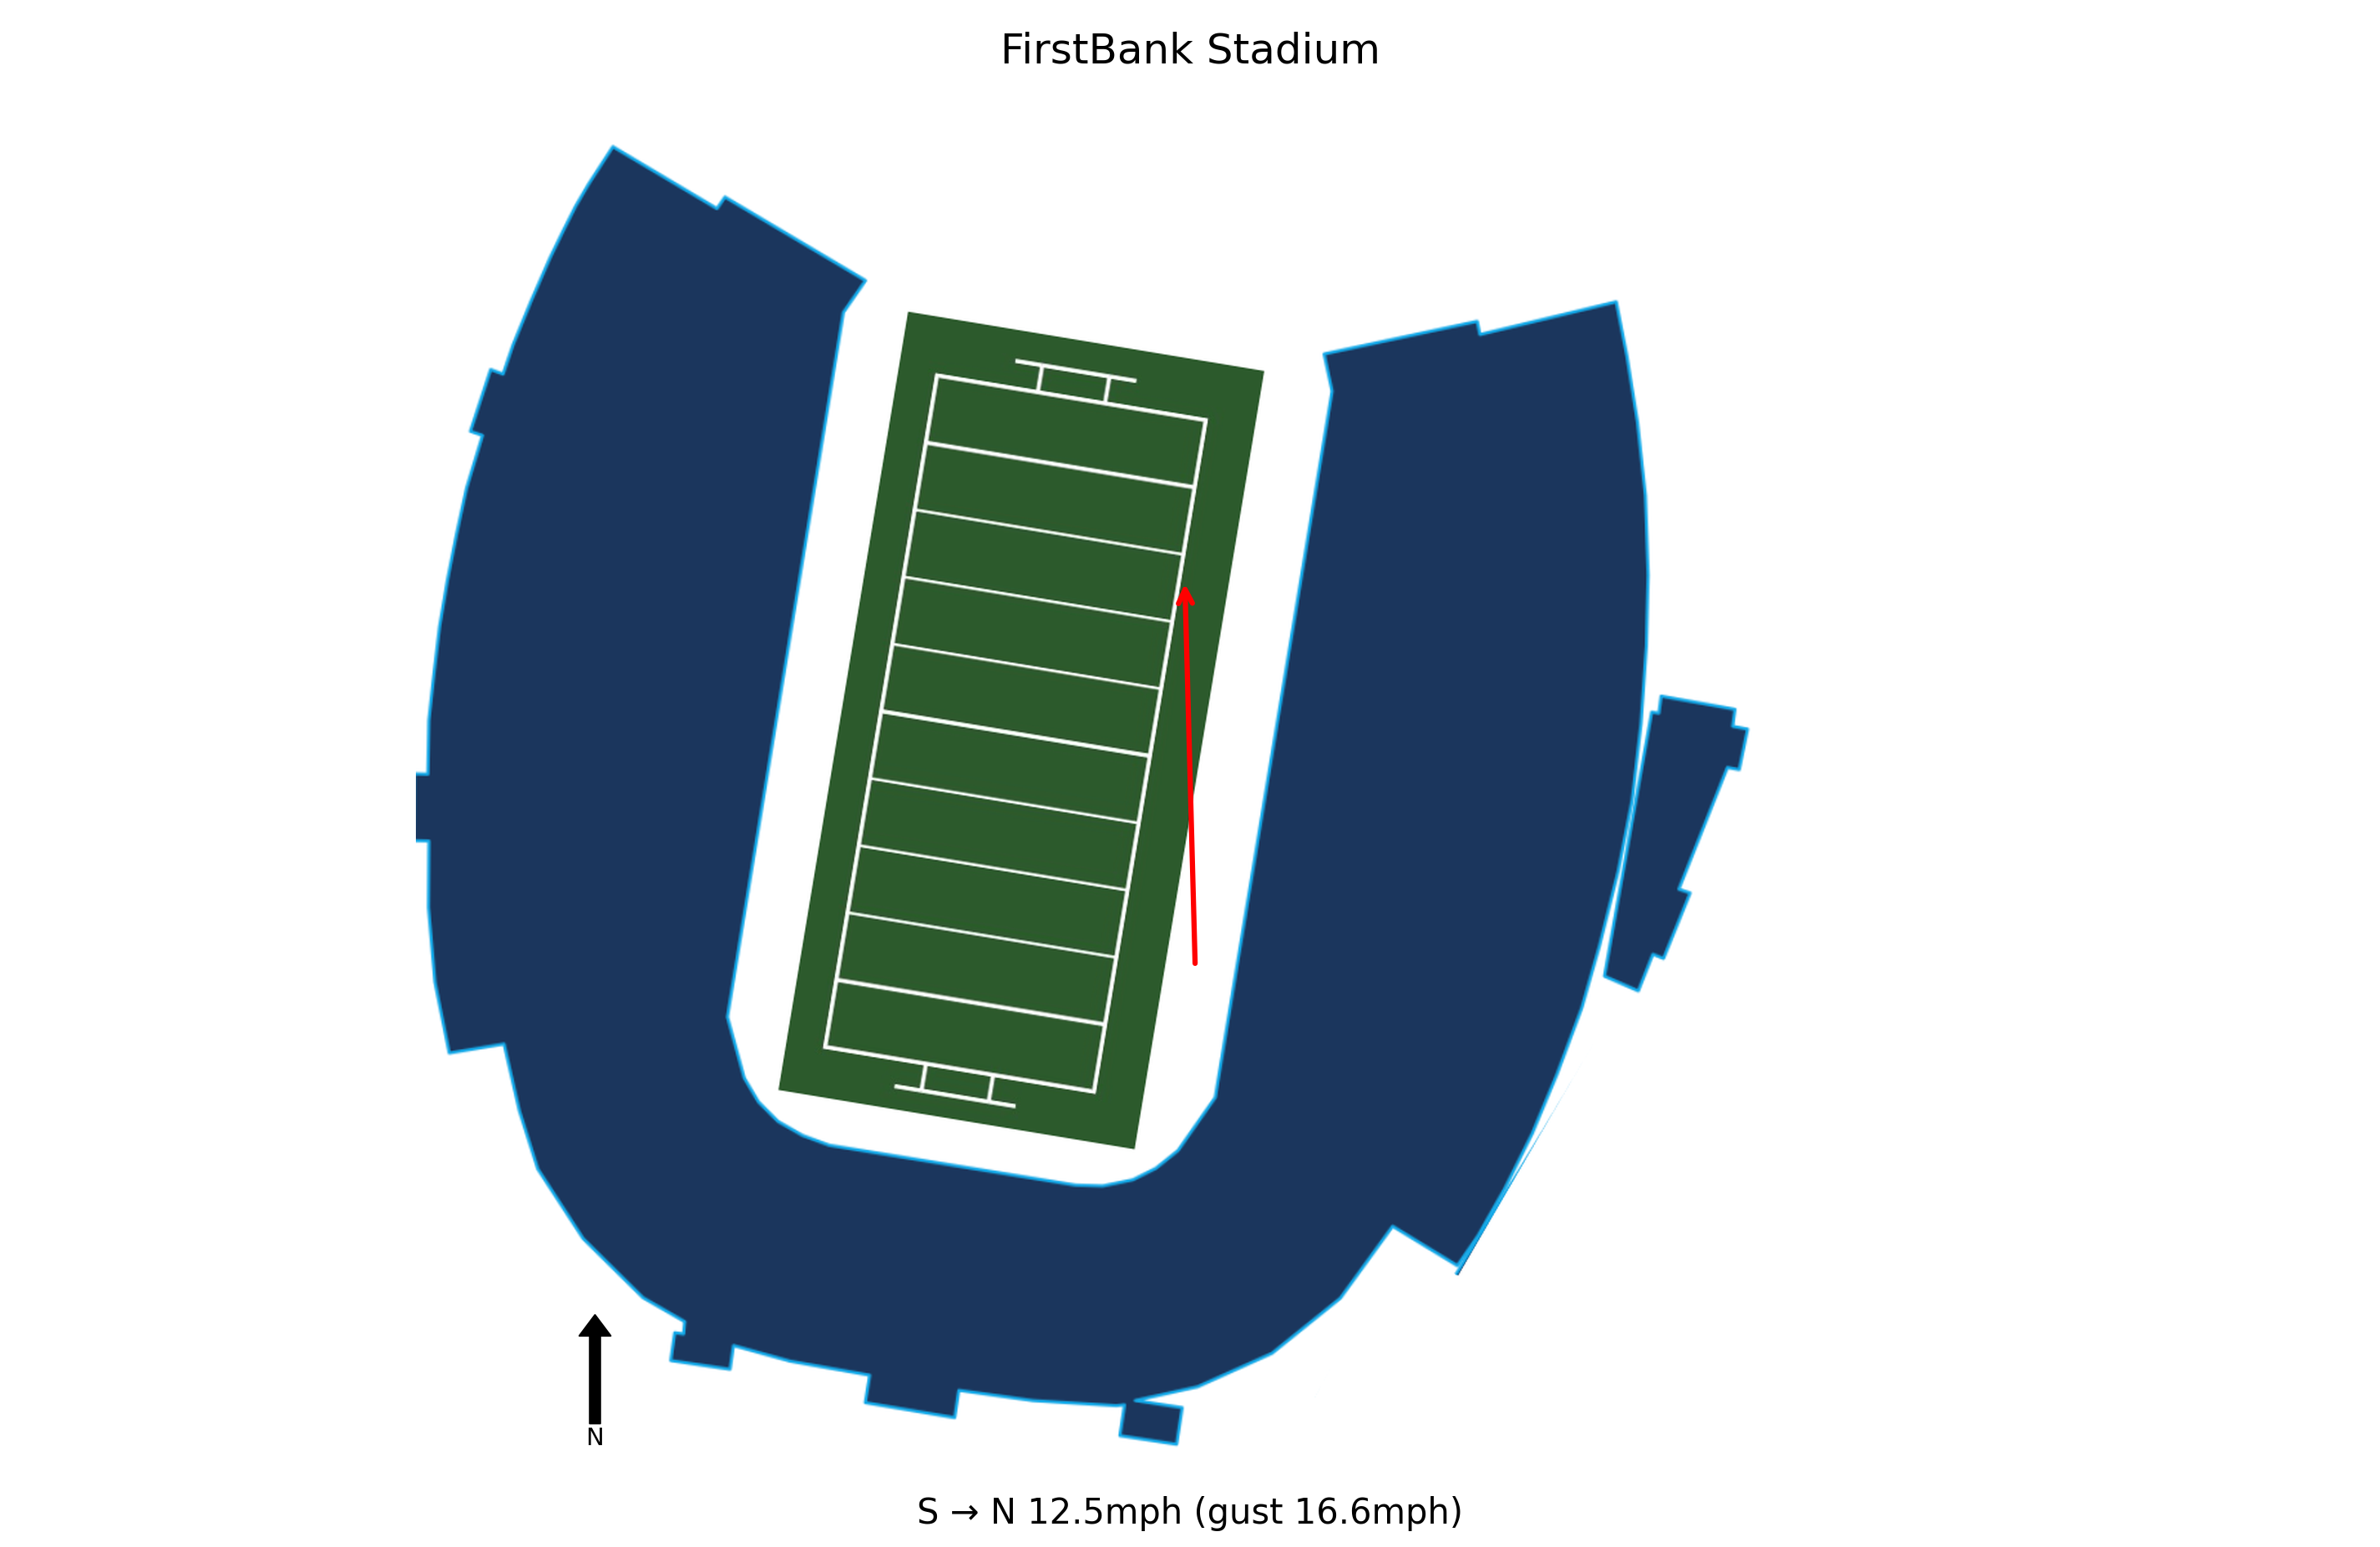
At kick-off, conditions at FirstBank Stadium were Sunny, 82.4°F, Heat Index 85.3°F with winds of 12.5 mph. Weather is not expected to be a meaningful factor in this game. Historical weather data for this game is preserved in the panel below.

82.4°F
LSU settled for field goals on multiple drives, including a 51-yard run to the Vanderbilt 2-yard line that resulted in only 3 points. Damian Ramos made kicks of 48, 42, and 23 yards but missed a 52-yarder, leaving points on the board.
LSU entered the game ranked 5th nationally allowing 11.8 points per game but gave up 31 points to Vanderbilt, the most this season. The defense struggled to contain Diego Pavia, who accounted for 246 total yards and 3 touchdowns.
The Tigers struggled to run the ball against a Vanderbilt defense ranked 16th nationally, limiting their ability to control the clock and sustain drives. This forced more reliance on the passing game.
Despite big plays like Garrett Nussmeier's 62-yard touchdown pass to Zavion Thomas and Caden Durham's 51-yard run, LSU failed to capitalize on scoring chances, leading to a loss in a game where they had opportunities to win.
LSU will face a tough test at home against undefeated Texas A&M on October 25. The Tigers must improve red zone efficiency and rushing attack to compete with a top-5 opponent.
Vanderbilt improved to 6-1 for the first time since 1950, snapping a 10-game losing streak to LSU and becoming bowl eligible. This marks a significant milestone for the program, which has traditionally aimed for bowl eligibility as a top goal.
Quarterback Diego Pavia threw for 160 yards and a touchdown, and rushed for 86 yards and two more scores, including a 21-yard run where he struck a Heisman pose. His ability to take over games has been a game-changer for the Commodores.
Vanderbilt's defense, ranked 16th nationally against the run, forced LSU to settle for four field goals, including a missed 52-yarder. Key plays like Zaylin Wood's sack on LSU's final drive prevented any comeback threat.
Vanderbilt's offense, averaging 43.2 points per game (7th nationally), scored the most points LSU has allowed this season. The Commodores punted only twice, both in the fourth quarter, showcasing their ability to sustain drives.
Vanderbilt will host No. 16 Missouri on October 25. With momentum from this win and a 2-1 SEC record, the Commodores will look to continue their historic season against another ranked opponent.
LSU travels 469 miles to this game, a moderate road trip.
Vanderbilt won by 7 in a one-score game.
Vanderbilt covered the spread.
The total went Over by 6.5 points.
Blue Chip Analytics power ratings favour Vanderbilt (16.4) over LSU (15.8) by 0.6 points on a neutral field. After adding home field advantage, the rating-implied line may differ meaningfully from the market spread. Vanderbilt brings a meaningful home field advantage to this matchup (Blue Chip HFA: 2.0). Add this to the neutral-site differential to arrive at a venue-adjusted line.
Blue Chip Analytics power ratings represent expected point margin against an average FBS opponent on a neutral field, calculated from game data sourced via CollegeFootballData.com (CFBD). They are one input: cross-reference with the travel, rest, and weather data above before drawing conclusions.
Vanderbilt won and Vanderbilt covered the spread.


