TCU defeated Baylor 42–36 in a closely contested finish. TCU covered by 2.5; Game went Over by 11.5.
Adjust any factor to update your projected line
Positive adjustment = favours home team
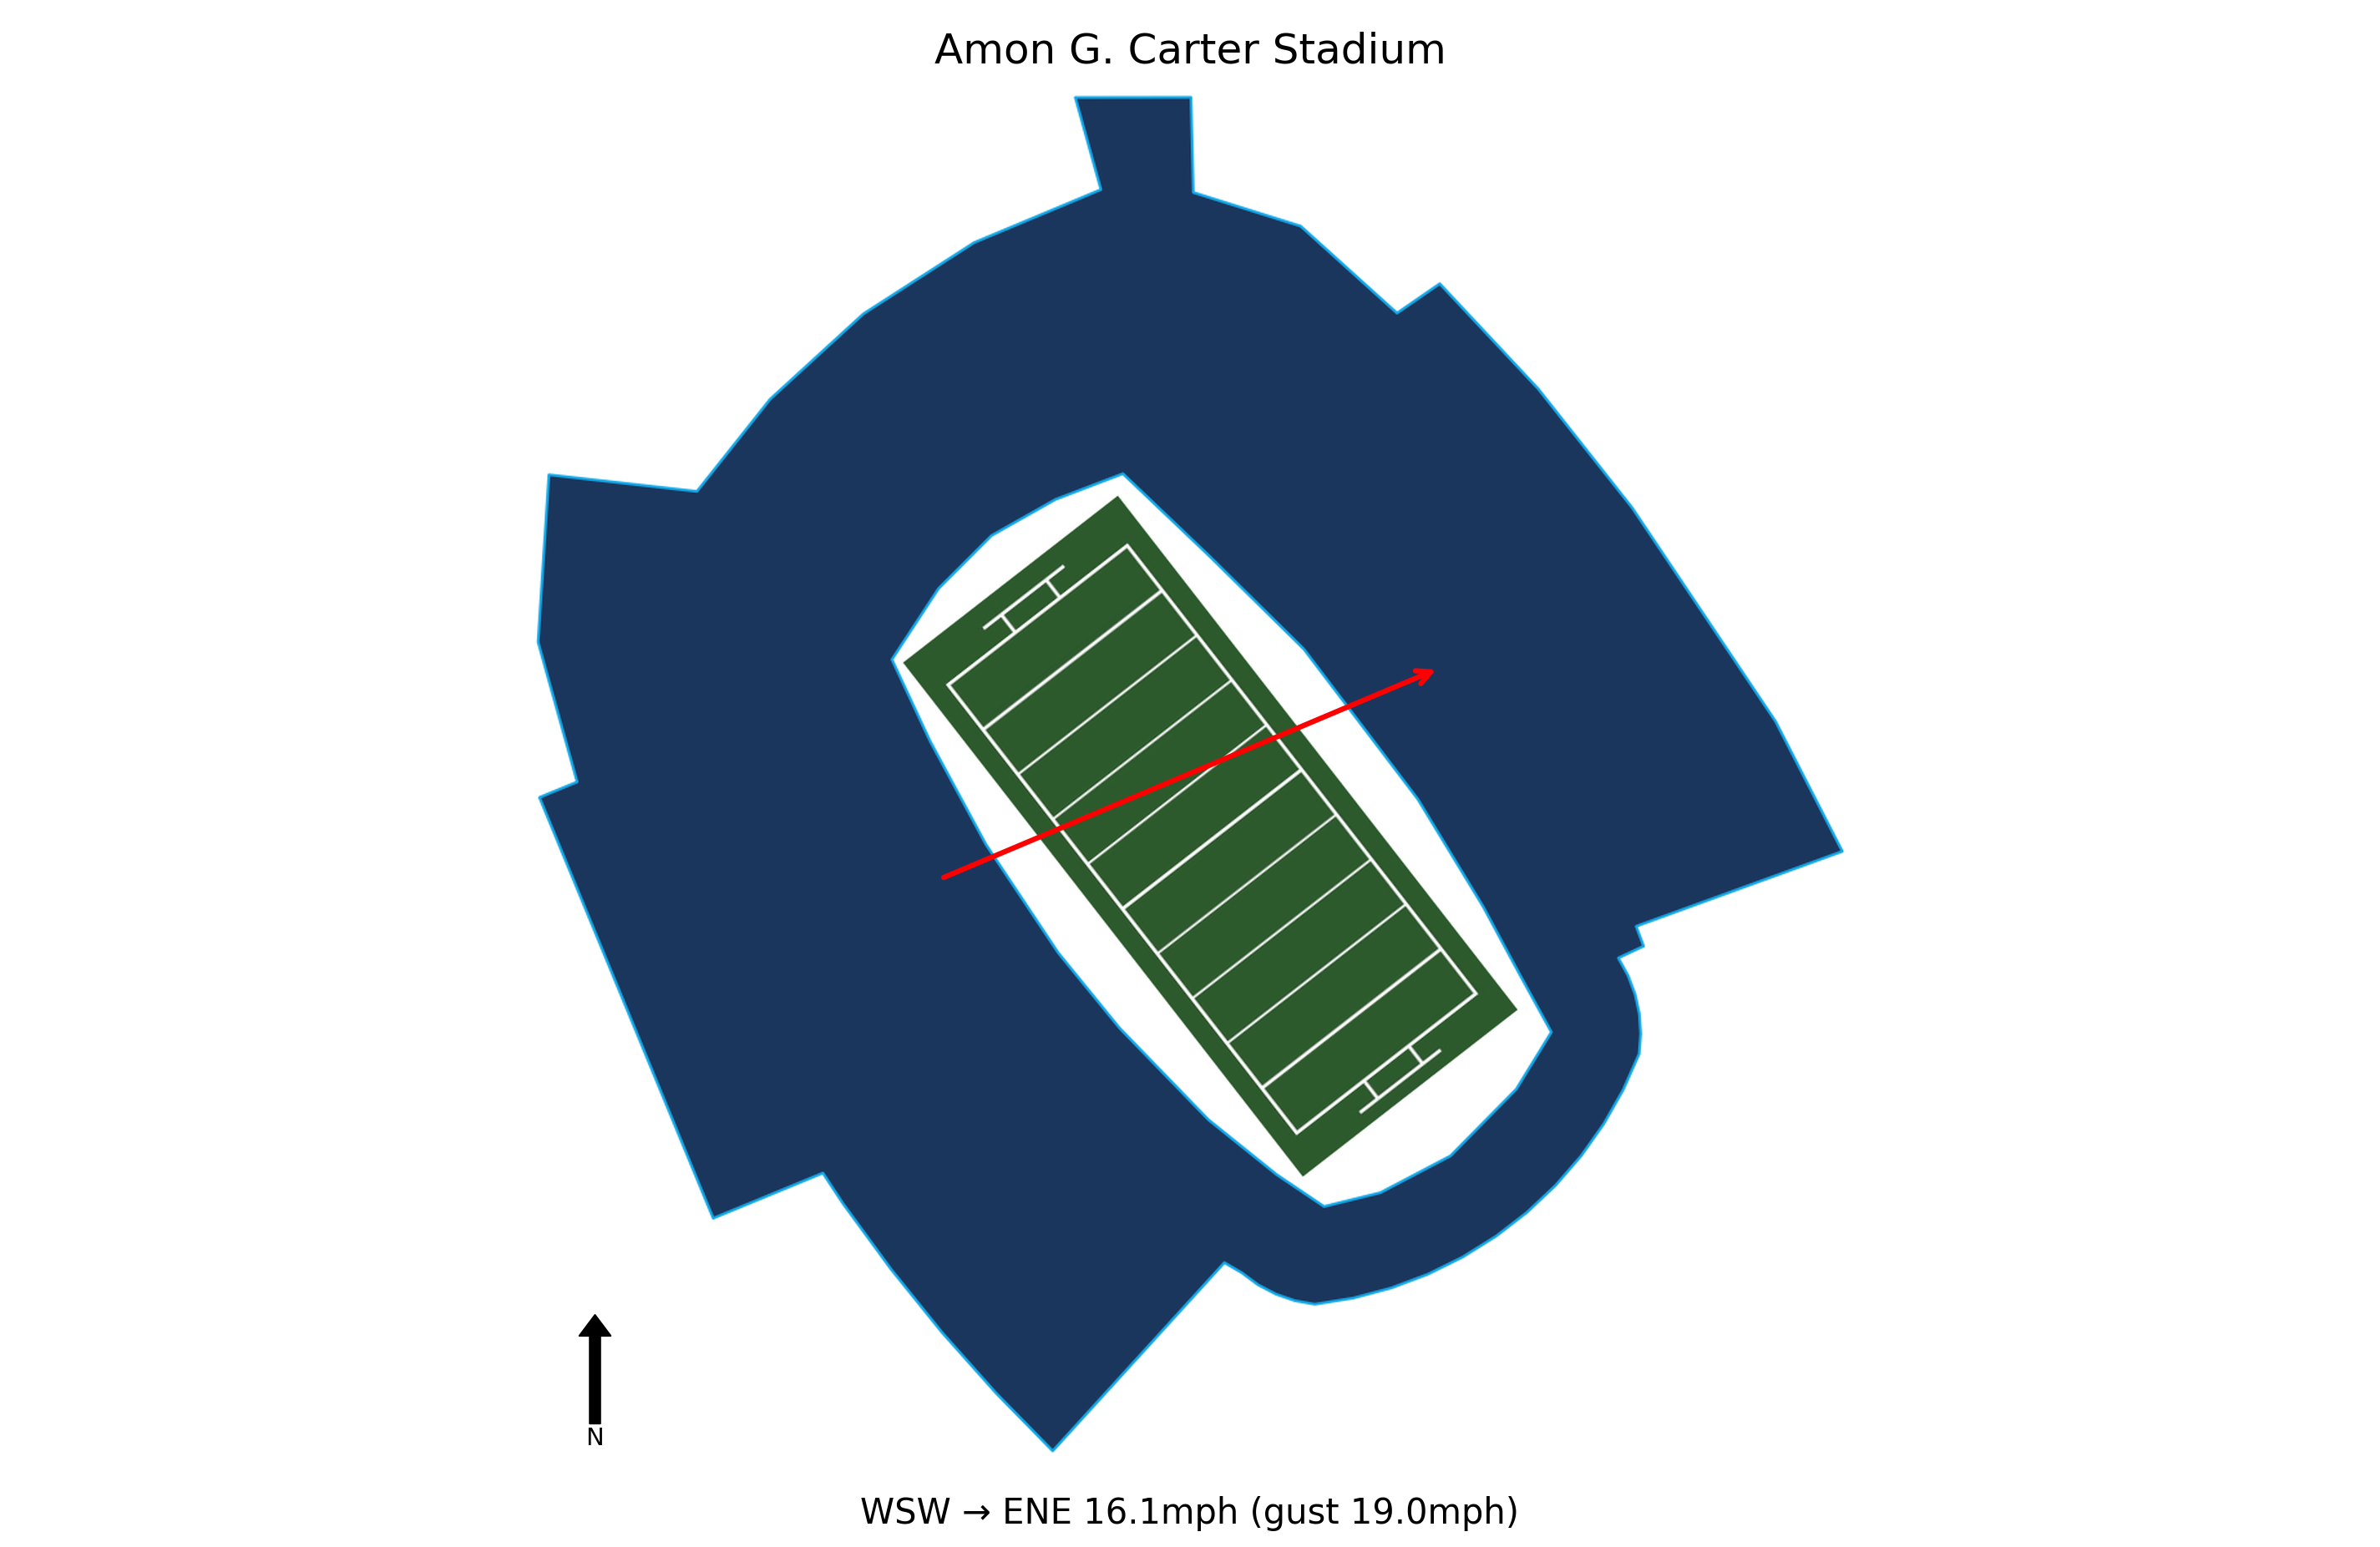
At kick-off, conditions at Amon G. Carter Stadium were Sunny, 92.5°F, Heat Index 99.3°F with winds of 16.1 mph. Wind of 16.1 mph creates a moderate passing and kicking risk. Monitor this figure closer to kickoff. Historical weather data for this game is preserved in the panel below.

92.5°F
Baylor committed three interceptions and a lost fumble after a two-hour lightning delay in the fourth quarter, directly leading to TCU's decisive 42-21 lead and ultimately the loss.
Despite being the national passing leader, Robertson completed only 25 of 52 passes (48%) for 318 yards with 2 TDs and 3 INTs, marking his first game with under 50% completions in over two years.
Baylor scored a defensive touchdown on a fumble return and a late 35-yard TD pass to Kobe Wilson, then recovered an onside kick, showing fight but falling short due to earlier mistakes.
The Bears had several dropped passes and missed open receivers, contributing to offensive inconsistency and failing to capitalize on scoring chances against a TCU defense that allowed 42 points.
Coming off a bye week and back-to-back wins, Baylor's players expressed frustration and disappointment, with coach Dave Aranda noting they know they are a good team but need to execute better in close games.
Josh Hoover threw for 231 yards and 3 TDs, while Kevorian Barnes rushed for 106 yards and 2 TDs, including a 14-yard direct snap score after a lightning delay. This balanced attack (passing and rushing) kept Baylor's defense off-balance and will be key against West Virginia.
TCU forced three interceptions (all after the lightning delay) and recovered a fumble, with Namdi Obiazor's pick sealing the win. Linebacker Caleb Elarms-Orr had 16 tackles, the most by a TCU player since 2009. This defensive performance, especially in clutch moments, bodes well for containing West Virginia's offense.
The game featured two lightning delays totaling over 2 hours, yet TCU maintained focus and executed when play resumed, scoring a TD on the first snap after the final delay. This mental toughness and adaptability will be crucial on the road at West Virginia.
TCU scored TDs on short-yardage plays (3-yard pass to Pimpton, 5-yard run by Barnes) and converted a 65-yard TD run by Battle. Their ability to finish drives and create explosive plays will be important against a West Virginia defense that can be vulnerable.
After a loss to Kansas State, TCU rebounded with a win over in-state rival Baylor, extending their series lead. This victory provides positive momentum and confidence heading into a road game at West Virginia, where they need to maintain focus and avoid letdowns.
Baylor travels 81 miles to this game, a short road trip.
TCU won by 6 in a closely contested finish.
TCU covered the spread narrowly.
The total went Over by 11.5 points.
Wind of 16.1 mph creates a moderate passing and kicking risk. Monitor this figure closer to kickoff.
Full conditions are shown in the data panel above. Forecast data sourced from WeatherAPI.com. Use the Line Value Calculator to apply a manual weather adjustment to your projected line.
Blue Chip Analytics power ratings favour TCU (12.3) over Baylor (10.0) by 2.3 points on a neutral field. After adding home field advantage, the rating-implied line may differ meaningfully from the market spread. TCU brings a meaningful home field advantage to this matchup (Blue Chip HFA: 2.5). Add this to the neutral-site differential to arrive at a venue-adjusted line.
Blue Chip Analytics power ratings represent expected point margin against an average FBS opponent on a neutral field, calculated from game data sourced via CollegeFootballData.com (CFBD). They are one input: cross-reference with the travel, rest, and weather data above before drawing conclusions.
TCU won and TCU covered the spread.


