Tennessee defeated UAB 56–24 in a dominant performance. UAB covered by 7.5; Game went Over by 10.5.
Adjust any factor to update your projected line
Positive adjustment = favours home team
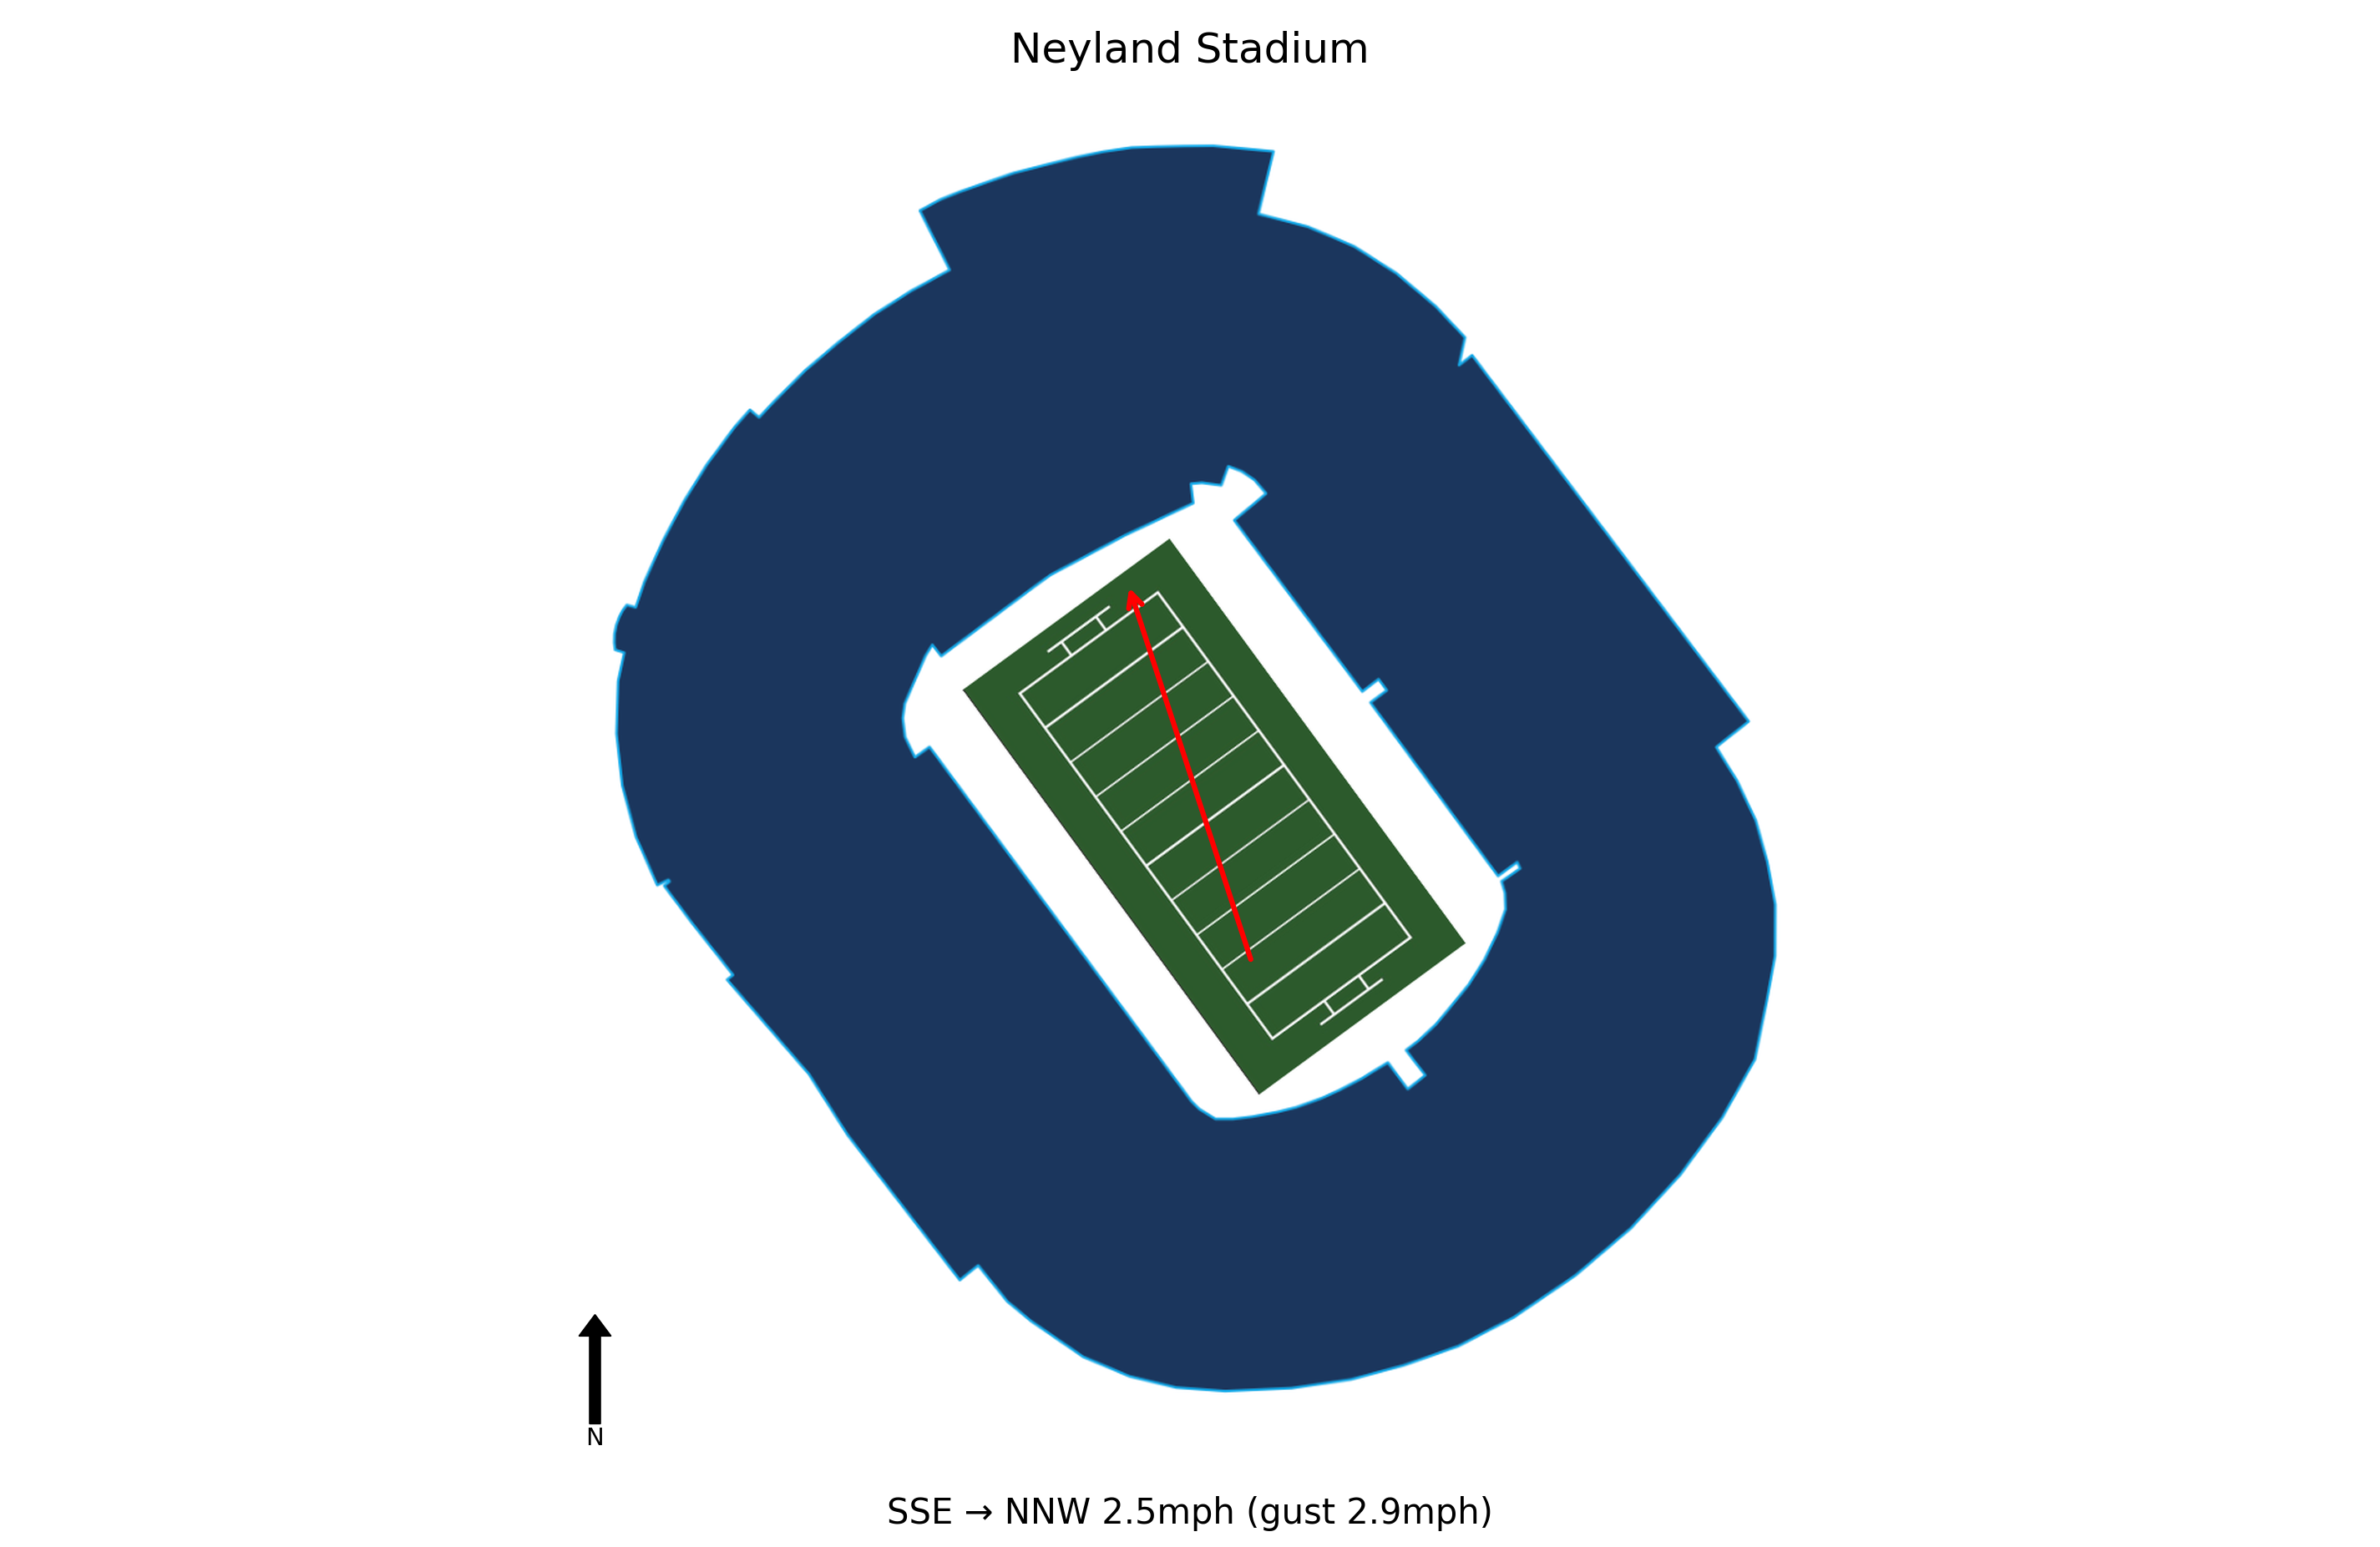
At kick-off, conditions at Neyland Stadium were Sunny, 82.4°F, Heat Index 84.7°F with winds of 2.5 mph. Weather is not expected to be a meaningful factor in this game. Historical weather data for this game is preserved in the panel below.

82.4°F
UAB scored 24 points against a top-15 Tennessee defense, showing offensive resilience. QB Jalen Kitna threw for 364 yards and 2 touchdowns, indicating the passing game can produce against elite competition.
The Blazers allowed 56 points and 235 rushing yards, with Tennessee leading 42-7 at halftime. This highlights significant defensive vulnerabilities, especially against a strong run game and efficient passing attack.
Coach Trent Dilfer noted that Tennessee's systems and discipline overwhelmed UAB early, but the team competed well in the second half. This experience may boost confidence for future games, as they likely won't face a team as strong as Tennessee.
UAB has an off week before hosting Army on Oct. 4. This extra time allows for rest, injury recovery, and game-planning adjustments, particularly to address defensive issues exposed by Tennessee.
After a loss to Georgia, Tennessee's offense rebounded with 56 points, 218 passing yards and 3 TDs from QB Joey Aguilar, plus 235 rushing yards and 4 TDs, showing improved balance and execution.
The Vols' run game, which struggled last week, accounted for 235 yards and 4 touchdowns, reinforcing its importance to the team's identity and providing a key weapon for upcoming games.
Despite the win, Tennessee's secondary allowed 364 passing yards and 2 TDs from UAB's Jalen Kitna, highlighting ongoing issues with injuries and young player development that could be exploited by Mississippi State.
Tennessee built a 42-7 halftime lead, allowing starters to rest in the second half, which preserves energy and reduces injury risk ahead of next week's road game at Mississippi State.
Coach Heupel noted the program's growth and control over the season's direction, while Aguilar emphasized learning to play fast, suggesting the offense is still improving and gaining confidence.
UAB travels 234 miles to this game, a short road trip.
UAB arrives with a 1-hour body clock shift.
Tennessee won by 32 in a dominant performance.
UAB covered the spread by a solid margin.
The total went Over by 10.5 points.
Blue Chip Analytics power ratings favour Tennessee (17.9) over UAB (-14.6) by 32.5 points on a neutral field. After adding home field advantage, the rating-implied line may differ meaningfully from the market spread. Tennessee brings one of the stronger home environments in the FBS to this matchup (Blue Chip HFA: 3.1). Add this to the neutral-site differential to arrive at a venue-adjusted line.
Blue Chip Analytics power ratings represent expected point margin against an average FBS opponent on a neutral field, calculated from game data sourced via CollegeFootballData.com (CFBD). They are one input: cross-reference with the travel, rest, and weather data above before drawing conclusions.
Tennessee won and UAB covered the spread.


