TCU defeated SMU 35–24 in a double-digit victory. TCU covered by 4.5; Game went Under by 4.5.
Adjust any factor to update your projected line
Positive adjustment = favours home team
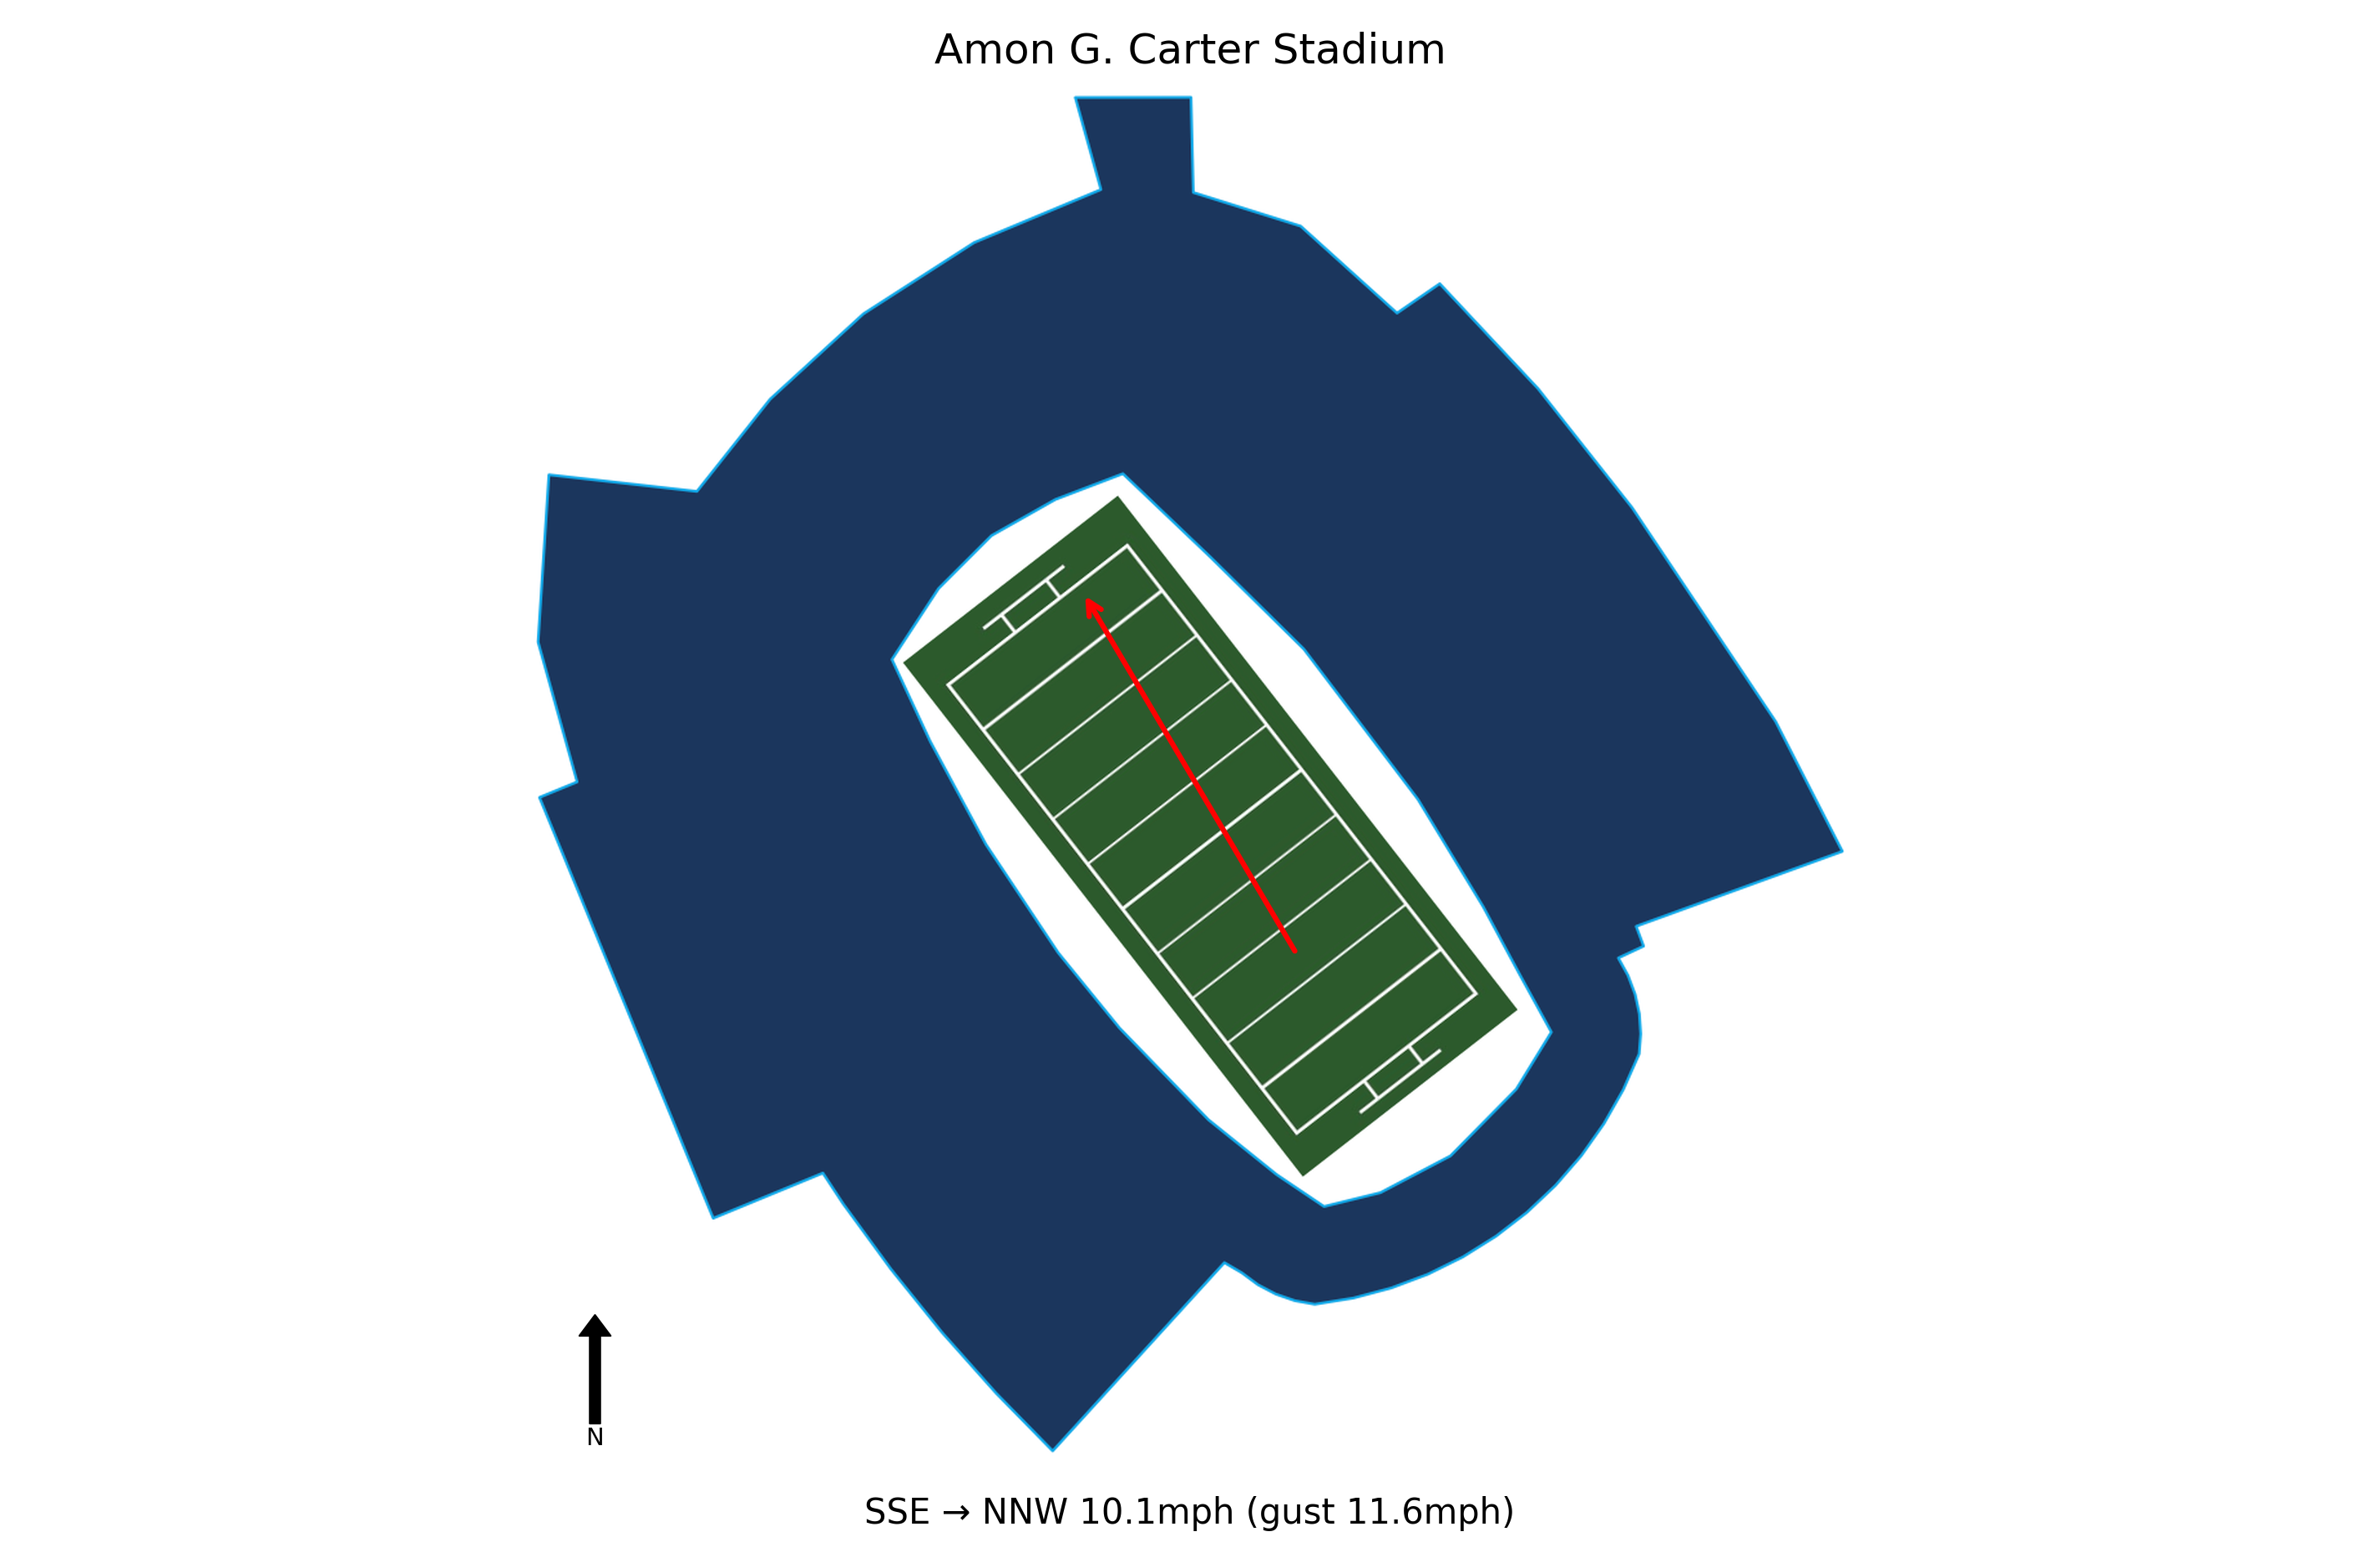
At kick-off, conditions at Amon G. Carter Stadium were Thundery outbreaks possible, 92.3°F, Heat Index 95.4°F with winds of 10.1 mph. Weather is not expected to be a meaningful factor in this game. Historical weather data for this game is preserved in the panel below.

92.3°F
SMU led 24-21 in the fourth quarter but allowed TCU to score 14 unanswered points, marking the second time this season they've lost when leading in the fourth quarter. This raises concerns about their ability to close out games.
Jennings threw for 290 yards and three touchdowns, but his two interceptions, including a critical one in the end zone late in the first half, were costly. His performance suggests potential but inconsistency.
TCU's Eric McAlister had 254 receiving yards and three touchdowns, including a 70-yard catch-and-run. SMU's secondary was exposed, which could be a vulnerability in ACC play.
SMU has an open date before hosting Syracuse on Oct. 4. This extra time allows them to address finishing issues and defensive lapses, but they must rebound quickly to stay competitive in their new conference.
McAlister had 8 catches for 254 yards and 3 TDs, including a 70-yard catch-and-run and a 44-yard score, showcasing his big-play ability and after-catch skills.
Hoover threw for 379 yards and 5 TDs (22-of-40), demonstrating strong arm and decision-making, especially under pressure on key third downs.
TCU outgained SMU 517-384 yards, with key plays like Joseph Manjack IV's 4-yard TD catch breaking multiple tackles, showing the offense's ability to overcome deficits and finish drives.
The defense forced two interceptions from SMU's Kevin Jennings, helping swing momentum and secure the win after SMU took a brief lead in the fourth quarter.
TCU travels to Arizona State on Friday night, needing to maintain offensive explosiveness and improve defensive consistency against a Sun Devils team that will test their secondary.
SMU travels 35 miles to this game, a short road trip.
TCU won by 11 in a double-digit victory.
TCU covered the spread.
The total went Under by 4.5 points.
Blue Chip Analytics power ratings favour TCU (11.3) over SMU (10.1) by 1.2 points on a neutral field. After adding home field advantage, the rating-implied line may differ meaningfully from the market spread. TCU brings a meaningful home field advantage to this matchup (Blue Chip HFA: 2.5). Add this to the neutral-site differential to arrive at a venue-adjusted line.
Blue Chip Analytics power ratings represent expected point margin against an average FBS opponent on a neutral field, calculated from game data sourced via CollegeFootballData.com (CFBD). They are one input: cross-reference with the travel, rest, and weather data above before drawing conclusions.
TCU won and TCU covered the spread.


