Vanderbilt defeated Georgia State 70–21 in a dominant performance. Vanderbilt covered by 21.5; Game went Over by 37.5.
Adjust any factor to update your projected line
Positive adjustment = favours home team
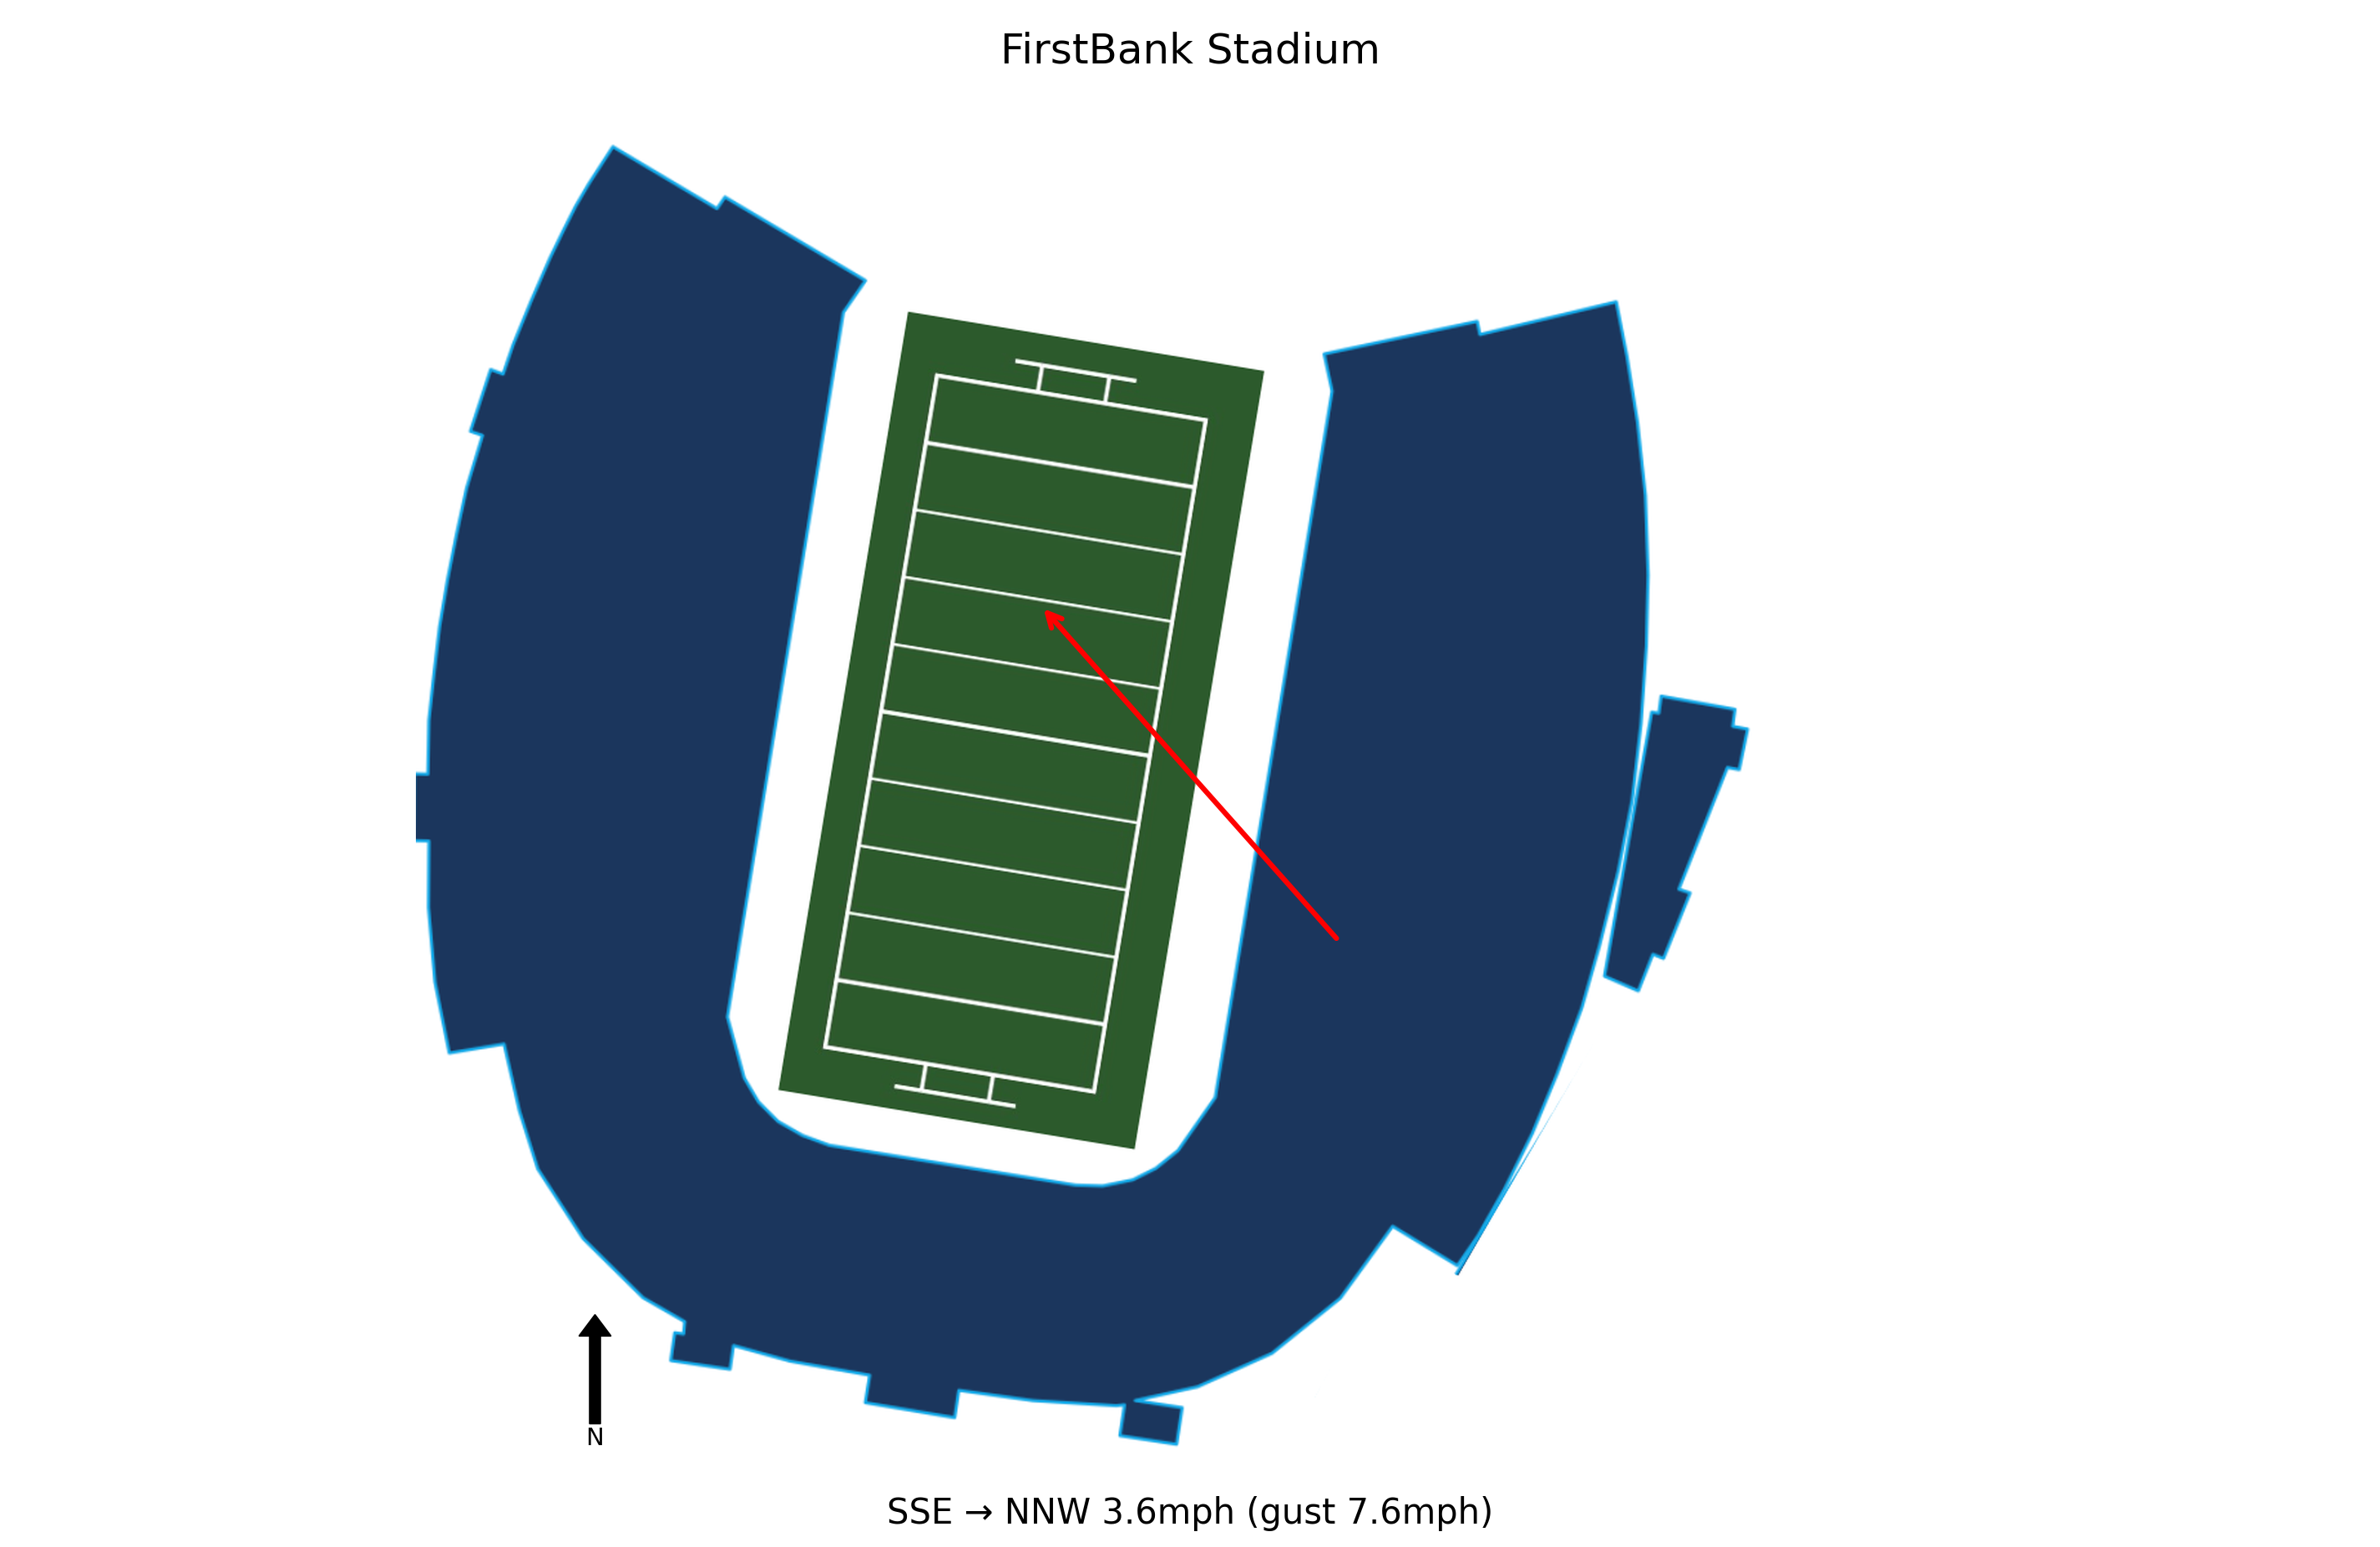
At kick-off, conditions at FirstBank Stadium were Partly cloudy, 77.5°F, Heat Index 80.2°F with winds of 3.6 mph. Weather is not expected to be a meaningful factor in this game. Historical weather data for this game is preserved in the panel below.

77.5°F
Georgia State allowed 70 points, the most Vanderbilt has scored in 107 years, and special teams were poor, converting only 1 of 3 extra-point attempts. This indicates major issues on defense and special teams that need addressing.
The Panthers managed only 32 rushing yards, showing a lack of ground game effectiveness. This could be a critical weakness against future opponents if not improved.
Quarterbacks TJ Finley and Cameran Brown combined for three touchdown passes, suggesting the aerial attack can be a strength. However, consistency and protection will be key moving forward.
Coach Dell McGee emphasized the need to 'dig deep' during the bye week to address the team's issues. This break could be crucial for adjustments before facing James Madison.
Georgia State hosts James Madison on Oct. 4. Given the current struggles, especially on defense and special teams, the Panthers will need significant improvement to compete.
Georgia State travels 215 miles to this game, a short road trip.
Georgia State arrives with a 1-hour body clock shift.
Vanderbilt won by 49 in a dominant performance.
Vanderbilt covered the spread comfortably.
The total went Over by 37.5 points.
Blue Chip Analytics power ratings favour Vanderbilt (14.7) over Georgia State (-16.9) by 31.6 points on a neutral field. After adding home field advantage, the rating-implied line may differ meaningfully from the market spread. Vanderbilt brings a meaningful home field advantage to this matchup (Blue Chip HFA: 2.0). Add this to the neutral-site differential to arrive at a venue-adjusted line.
Blue Chip Analytics power ratings represent expected point margin against an average FBS opponent on a neutral field, calculated from game data sourced via CollegeFootballData.com (CFBD). They are one input: cross-reference with the travel, rest, and weather data above before drawing conclusions.
Vanderbilt won and Vanderbilt covered the spread.


