Texas State defeated UTSA 43–36 in a one-score game. Texas State covered by 11.5; Game went Over by 14.5. Blue Chip Analytics had rated UTSA 3.5 points stronger on a neutral field.
Adjust any factor to update your projected line
Positive adjustment = favours home team
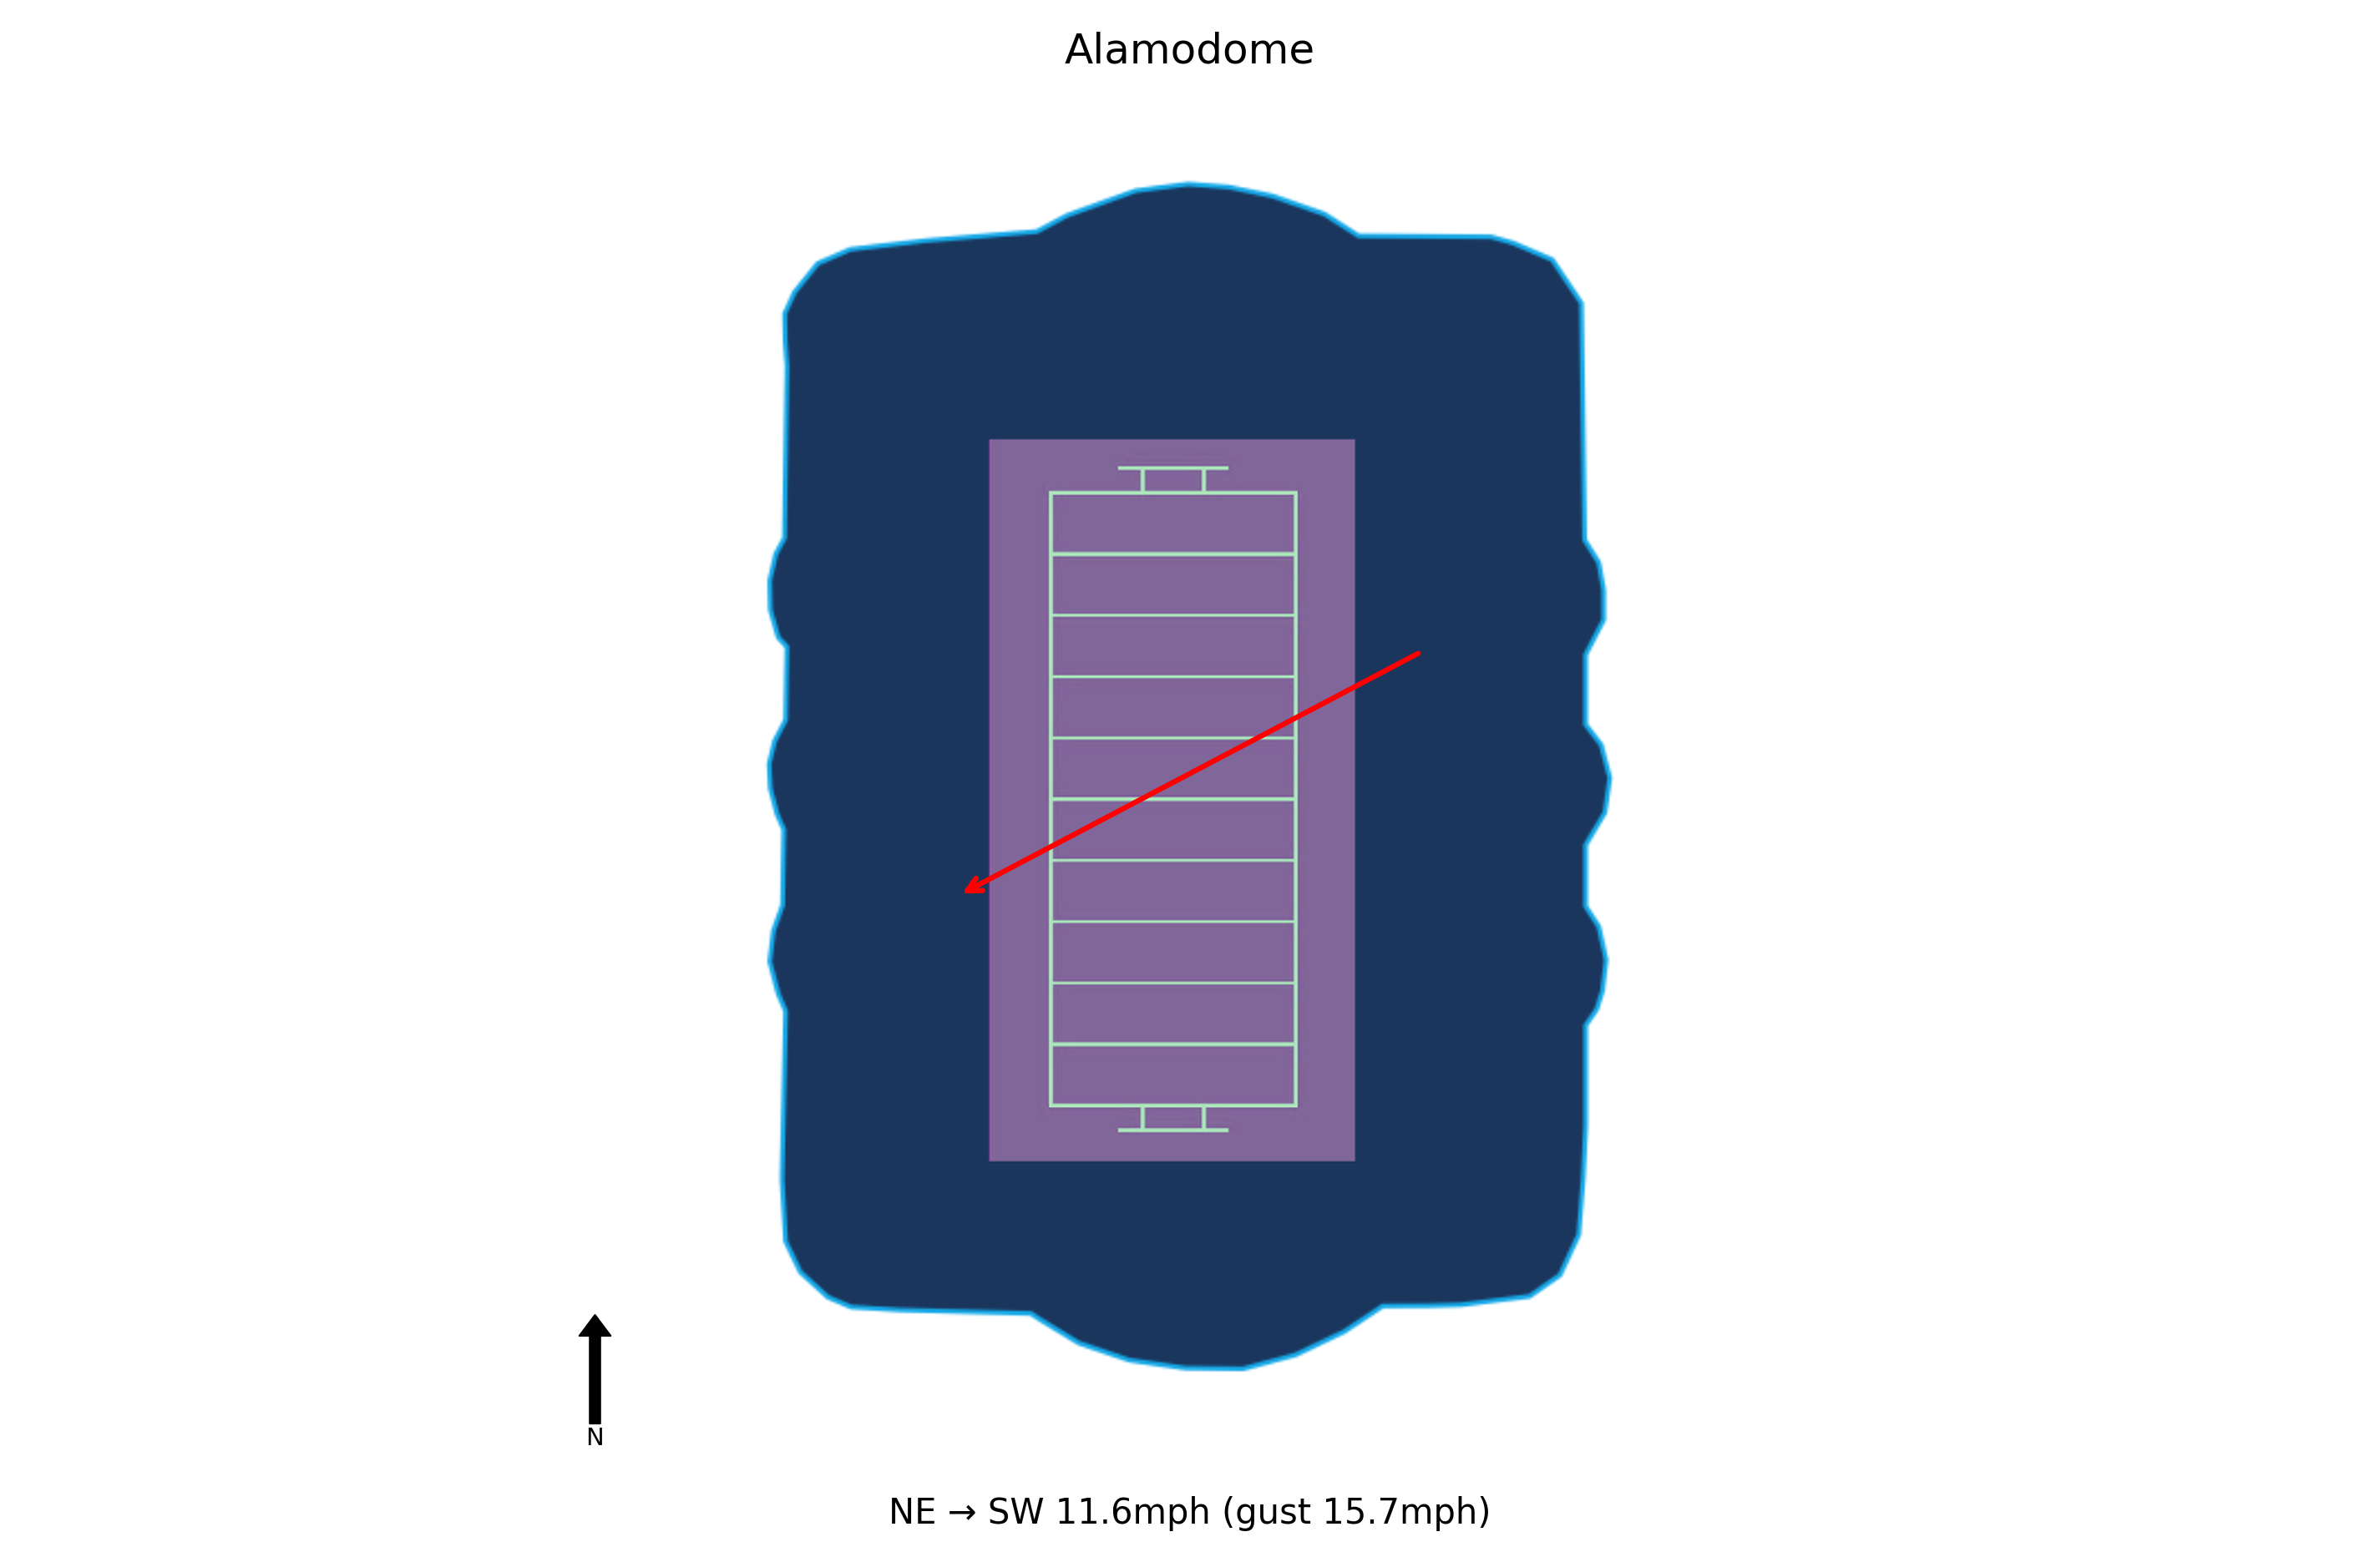
This game was played indoors at Alamodome in a climate-controlled environment. Weather was not a factor.
~72°F
Texas State's offense generated 951 total yards, with Brad Jackson throwing for 286 yards and Beau Sparks catching five passes for 155 yards, including a 65-yard touchdown. Robert Henry added 159 rushing yards and two touchdowns, including a 75-yard run.
The Texas State defense forced three straight incompletions on UTSA's final drive to secure a turnover on downs, with Ryan Nolan recording 11 tackles and Kenard Snyder getting the lone sack.
Texas State has won two straight against UTSA in the I-35 Rivalry, improving to 2-0 on the season. The team showed resilience with six lead changes and a tie, taking the lead for good on the first play of the fourth quarter.
Texas State travels 47 miles to this game, a short road trip.
Texas State won by 7 in a one-score game.
Texas State covered the spread by a solid margin.
The total went Over by 14.5 points.
Blue Chip Analytics power ratings favour UTSA (-3.0) over Texas State (-6.5) by 3.5 points on a neutral field. After adding home field advantage, the rating-implied line may differ meaningfully from the market spread. UTSA brings a meaningful home field advantage to this matchup (Blue Chip HFA: 2.9). Add this to the neutral-site differential to arrive at a venue-adjusted line.
Blue Chip Analytics power ratings represent expected point margin against an average FBS opponent on a neutral field, calculated from game data sourced via CollegeFootballData.com (CFBD). They are one input: cross-reference with the travel, rest, and weather data above before drawing conclusions.
Texas State won and Texas State covered the spread.


