Vanderbilt defeated Tennessee 45–24 to secure a comfortable win. Vanderbilt covered by 23.5; Game went Over by 2.5.
Adjust any factor to update your projected line
Positive adjustment = favours home team
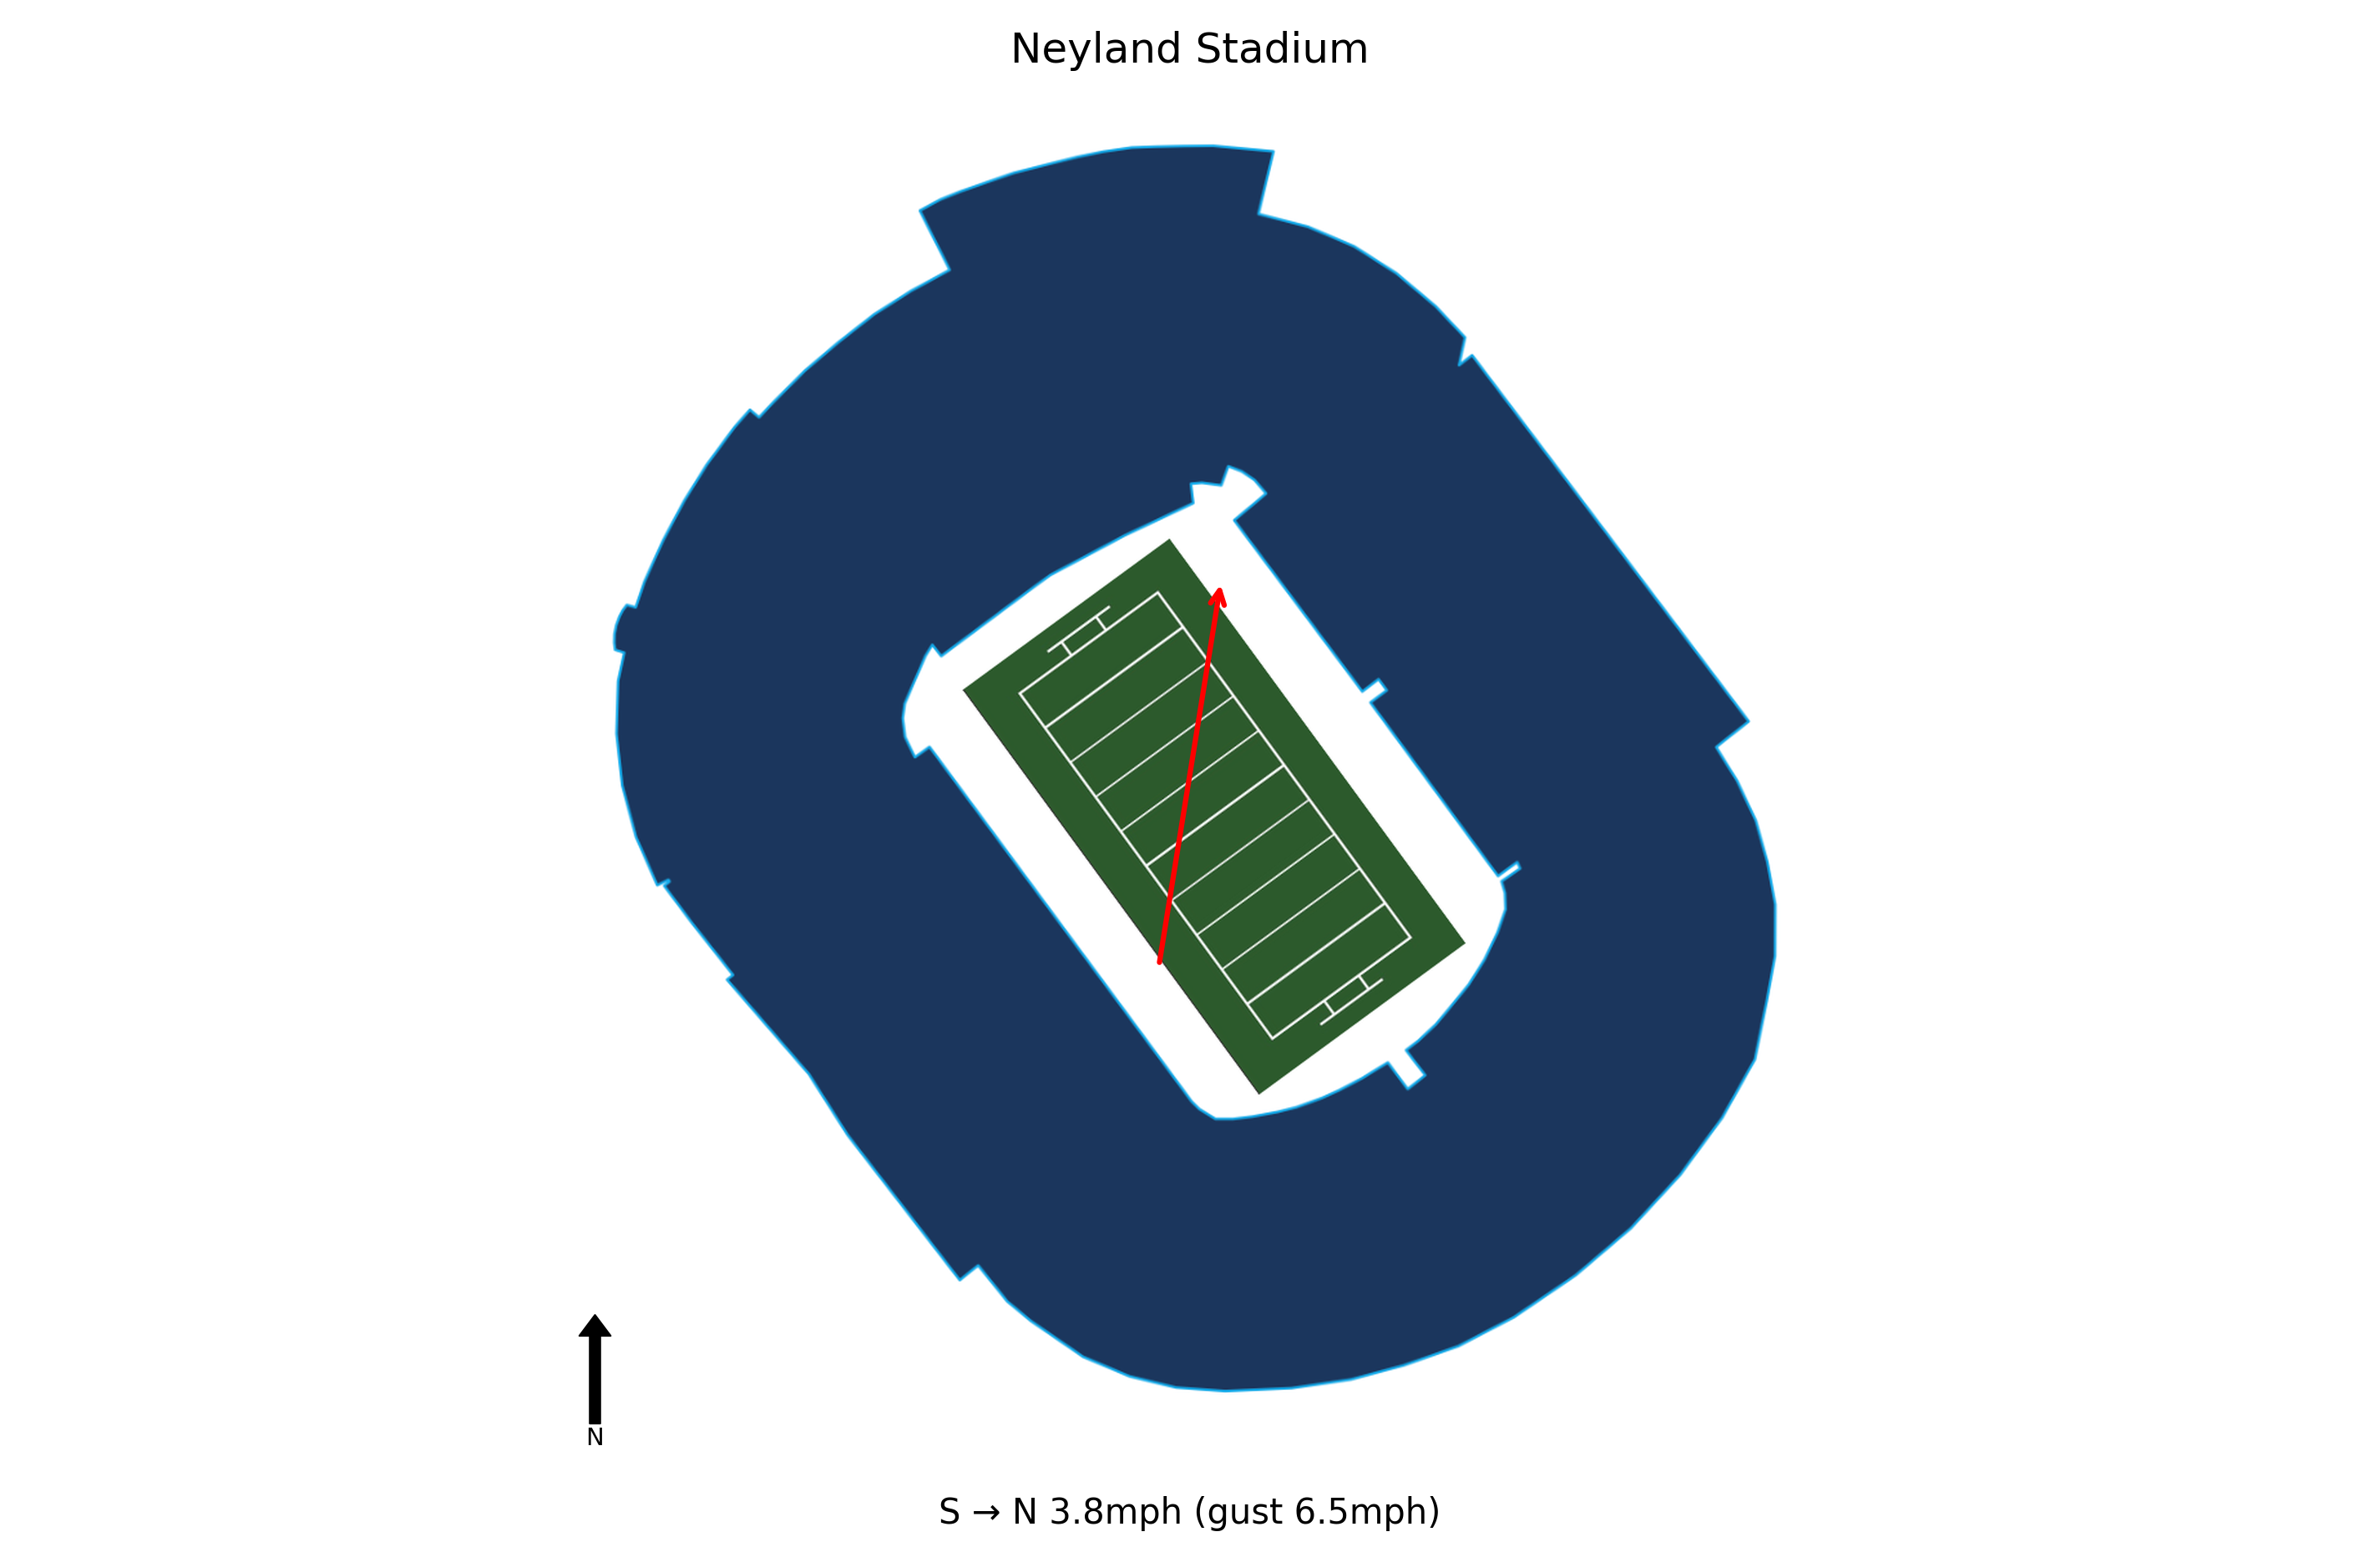
At kick-off, conditions at Neyland Stadium were Overcast, 40.1°F, Wind Chill 34.9°F with winds of 3.8 mph. Weather is not expected to be a meaningful factor in this game. Historical weather data for this game is preserved in the panel below.

40.1°F
Vanderbilt secured its first 10-win season in program history with a dominant 45-24 win over No. 18 Tennessee, keeping its College Football Playoff hopes alive. The Commodores' strong performance, especially against a ranked rival, puts pressure on the CFP committee to consider them for a spot.
Quarterback Diego Pavia was the catalyst, throwing for 268 yards and a touchdown while rushing for 165 yards and another score. His confidence and playmaking ability were key to Vanderbilt's 582 total yards, making him a critical factor in any postseason matchup.
Sedrick Alexander added 115 rushing yards and three touchdowns, and the Commodores dominated the third quarter, holding the ball for the first 6:35 and scoring two touchdowns to break a 21-21 halftime tie. This ability to control the game on the ground and in time of possession will be vital in their next game.
Amid interest from Florida, Vanderbilt signed coach Clark Lea to a six-year extension, providing stability and motivation. The team's response to this news was a focused, record-setting performance, indicating strong leadership and unity heading into the postseason.
Tennessee's defense allowed 24 points in the second half, including a 5-yard touchdown run and a 24-yard rushing score by Diego Pavia, leading to a 45-24 loss. Coach Heupel called the performance 'not anywhere near the standard for Tennessee football.'
The loss to Vanderbilt ended Tennessee's chance at a 10-win regular season, finishing 8-4. This is a deflating result, especially at home against an in-state rival.
Quarterback Joey Aguilar threw for 299 yards and a touchdown, extending his streak of 200+ passing yards to 12 games. He surpassed Peyton Manning for fourth on Tennessee's all-time single-season passing list.
DeSean Bishop rushed for 97 yards and two touchdowns, providing a bright spot in the offense. However, the team's overall rushing attack was overshadowed by Vanderbilt's 582 total yards.
Tennessee will play its next game in the postseason, but the loss to Vanderbilt likely drops them in bowl projections and dampens momentum heading into the offseason.
Vanderbilt travels 162 miles to this game, a short road trip.
Vanderbilt arrives with a 1-hour body clock shift.
Vanderbilt won by 21 to secure a comfortable win.
Vanderbilt covered the spread comfortably.
The total went Over by 2.5 points.
Blue Chip Analytics power ratings favour Tennessee (20.1) over Vanderbilt (17.5) by 2.6 points on a neutral field. After adding home field advantage, the rating-implied line may differ meaningfully from the market spread. Tennessee brings one of the stronger home environments in the FBS to this matchup (Blue Chip HFA: 3.1). Add this to the neutral-site differential to arrive at a venue-adjusted line.
Blue Chip Analytics power ratings represent expected point margin against an average FBS opponent on a neutral field, calculated from game data sourced via CollegeFootballData.com (CFBD). They are one input: cross-reference with the travel, rest, and weather data above before drawing conclusions.
Vanderbilt won and Vanderbilt covered the spread.


