UNLV defeated Colorado State 42–10 in a dominant performance. UNLV covered by 26.5; Game went Under by 8.5.
Adjust any factor to update your projected line
Positive adjustment = favours home team
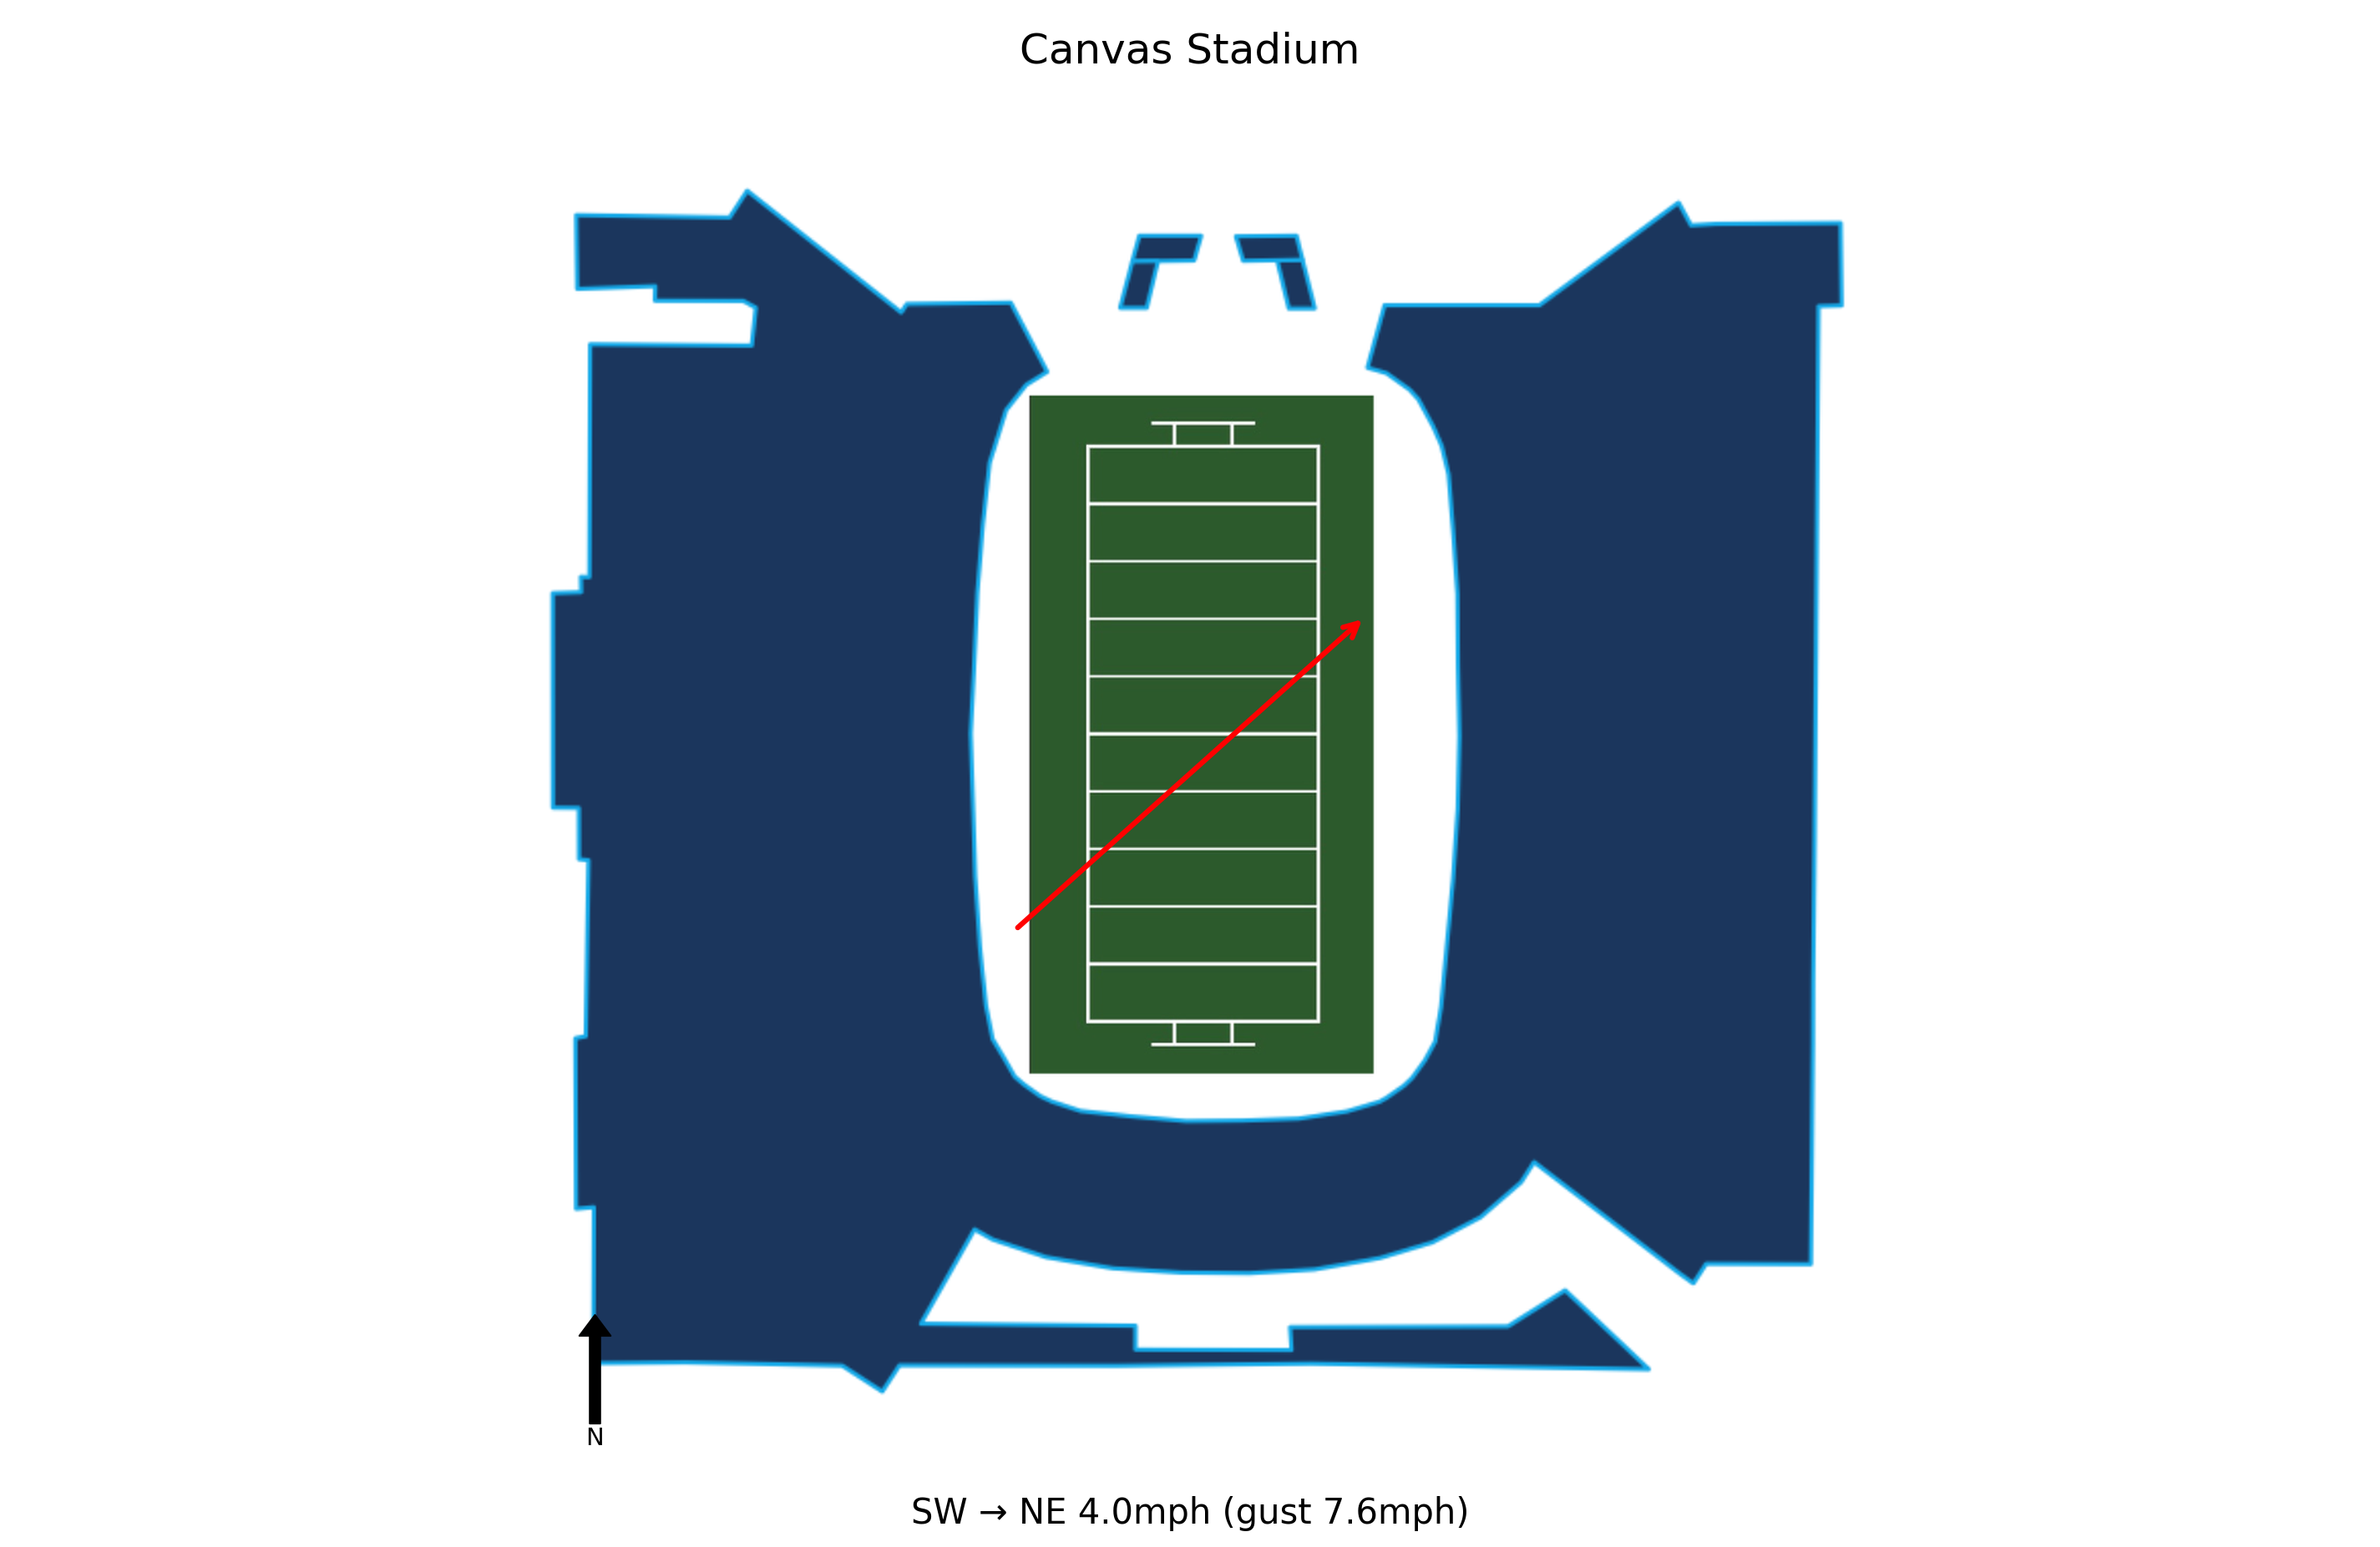
At kick-off, conditions at Canvas Stadium were Clear, 30.0°F, Wind Chill 25.2°F with winds of 4.0 mph. At 30.0°F, this is a cold-weather game. Cold conditions below 32°F historically compress scoring and reduce passing efficiency, favouring unders and run-heavy offences. Historical weather data for this game is preserved in the panel below.

30.0°F
Colorado State converted only 1 of 13 third-down attempts, severely limiting their ability to sustain drives and control the clock. This inefficiency contributed to a lopsided 571-292 total yard deficit.
UNLV rushed for 320 yards at an average of 7.8 yards per carry, including a 57-yard touchdown run. Colorado State's run defense was consistently gashed, allowing big plays and failing to force UNLV into passing situations.
Despite an early 3-yard touchdown pass from Jackson Brousseau to Rocky Beers and a field goal, the offense managed only 10 points. The team failed to build on the early lead and was outscored 28-0 after the first quarter.
The passing attack was limited, with no deep threats or consistent completions beyond short gains. The offense lacked explosiveness, which allowed UNLV to stack the box and focus on stopping the run.
Colorado State's defense gave up multiple explosive plays, including a 68-yard touchdown pass and a 57-yard run. These big plays quickly shifted momentum and put the Rams in a deep hole they could not recover from.
UNLV travels 629 miles to this game, a moderate road trip.
UNLV arrives with a 1-hour body clock shift.
UNLV won by 32 in a dominant performance.
UNLV covered the spread comfortably.
The total went Under by 8.5 points.
At 30.0°F, this is a cold-weather game. Cold conditions below 32°F historically compress scoring and reduce passing efficiency, favouring unders and run-heavy offences.
Full conditions are shown in the data panel above. Forecast data sourced from WeatherAPI.com. Use the Line Value Calculator to apply a manual weather adjustment to your projected line.
Blue Chip Analytics power ratings favour UNLV (-1.8) over Colorado State (-8.2) by 6.4 points on a neutral field. Despite playing at home, Colorado State faces a power rating deficit. Check whether the market spread accounts for this gap. Colorado State brings a meaningful home field advantage to this matchup (Blue Chip HFA: 2.0). Add this to the neutral-site differential to arrive at a venue-adjusted line.
Blue Chip Analytics power ratings represent expected point margin against an average FBS opponent on a neutral field, calculated from game data sourced via CollegeFootballData.com (CFBD). They are one input: cross-reference with the travel, rest, and weather data above before drawing conclusions.
UNLV won and UNLV covered the spread.


