Texas defeated Vanderbilt 34–31 in a nail-biter. Vanderbilt covered by 0.5; Game went Over by 16.5.
Adjust any factor to update your projected line
Positive adjustment = favours home team
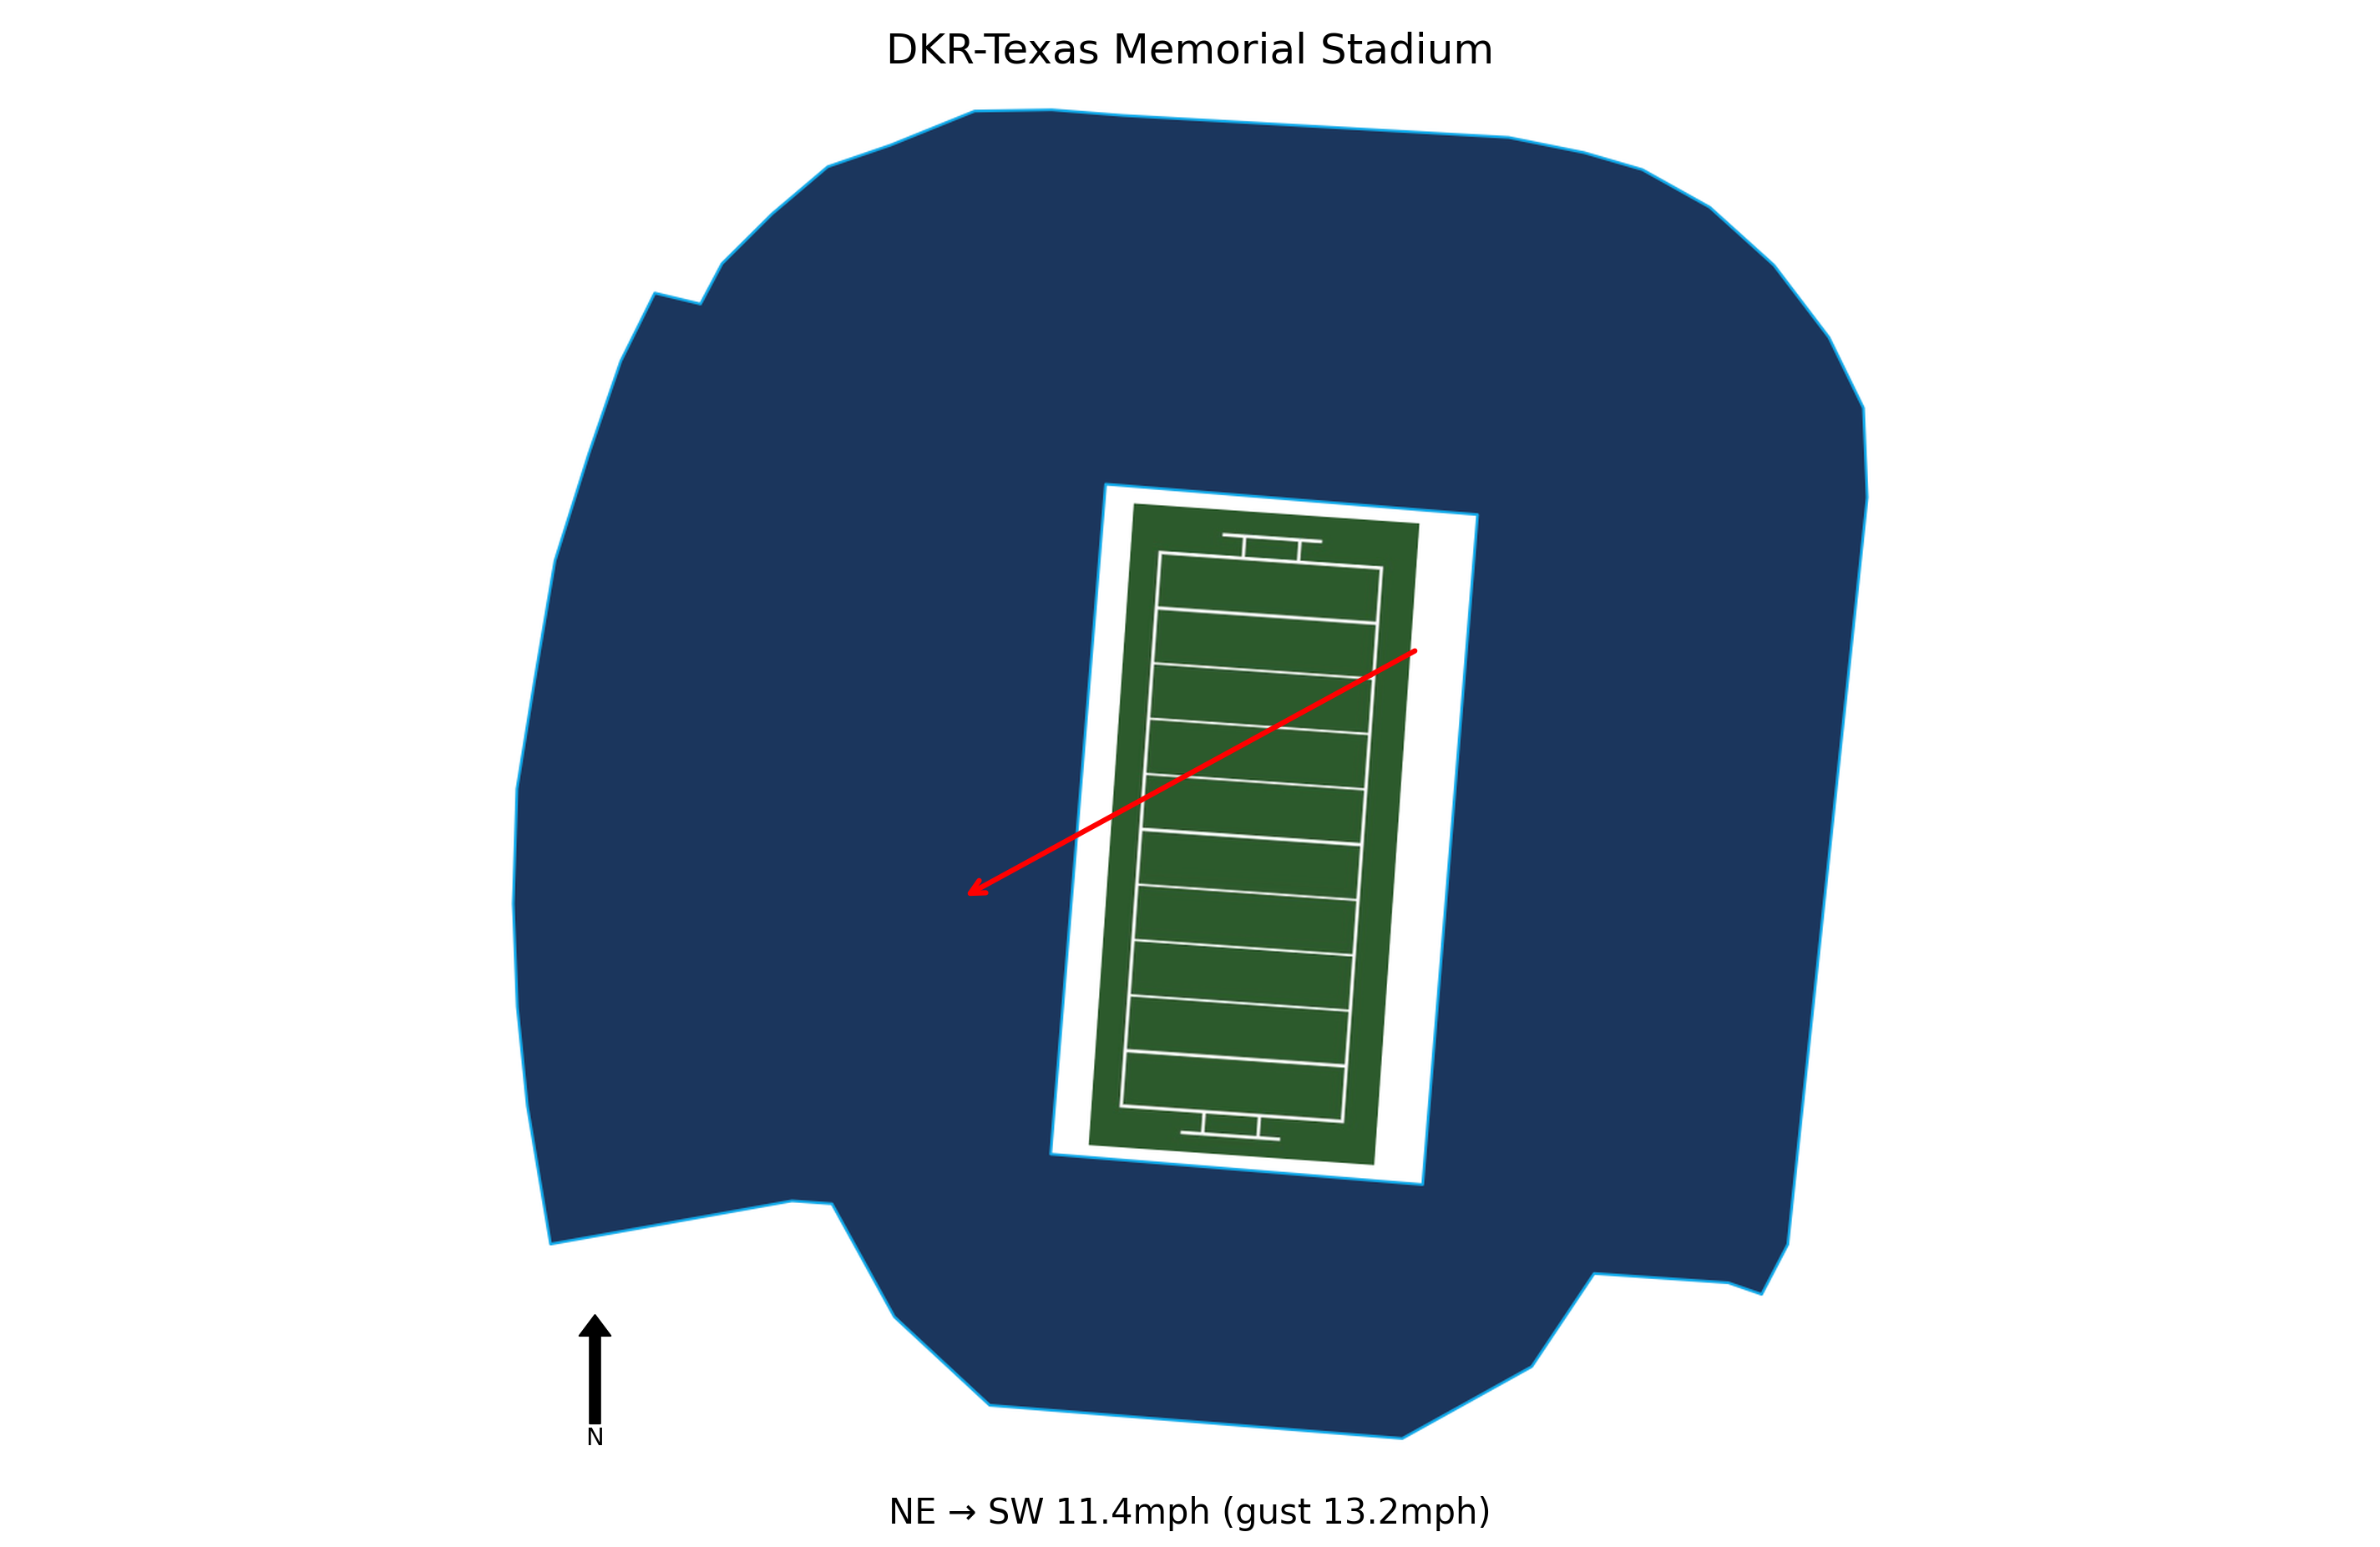
At kick-off, conditions at DKR-Texas Memorial Stadium were Sunny, 72.1°F, Feels Like 76.1°F with winds of 11.4 mph. Weather is not expected to be a meaningful factor in this game. Historical weather data for this game is preserved in the panel below.

72.1°F
Vanderbilt trailed 34-10 in the fourth quarter but scored 21 unanswered points, including a 67-yard touchdown pass and a final score with 33 seconds left, nearly completing a comeback.
Quarterback Diego Pavia threw for a career-high 365 yards and accounted for 408 total yards, despite being sacked six times and limited early, showing his ability to produce under pressure.
The Commodores' onside kick attempt with 33 seconds remaining bounced through several players and rolled out of bounds, ending their rally and leaving them inches from recovery.
The loss hurts Vanderbilt's SEC championship aspirations, as they fall to 3-2 in conference play, but the narrow defeat shows they can compete with top teams.
Vanderbilt allowed 34 points and 328 passing yards, including a 75-yard touchdown on the first play, and struggled to pressure Texas quarterback Arch Manning until late in the game.
Manning returned from a concussion to throw for 328 yards and 3 touchdowns, including a 75-yard score on the first play. He completed 25 of 33 passes and showed resilience after a hard hit, indicating he is a key offensive asset moving forward.
Texas built a 34-10 lead in the fourth quarter but allowed Vanderbilt to score 21 unanswered points, nearly losing the game. This highlights a need for better late-game execution and defensive discipline, especially against top opponents.
The defense sacked Vanderbilt's quarterback six times and limited his running early, but struggled to contain him in the fourth quarter, allowing 365 passing yards. This inconsistency could be exploited by Georgia's offense.
The win keeps Texas in SEC title contention and within reach of a third straight College Football Playoff berth. A four-game win streak, including a top-10 victory, builds confidence but the narrow escape may serve as a wake-up call.
Texas plays at No. 5 Georgia on Nov. 15, a critical road test. The team must improve pass protection and late-game defense to compete against a strong Bulldogs squad, as Manning's protection was noted as the best all year but may face stiffer pressure.
Vanderbilt travels 750 miles to this game, a moderate road trip.
Texas won by 3 in a nail-biter.
Vanderbilt covered the spread narrowly.
The total went Over by 16.5 points.
Blue Chip Analytics power ratings favour Texas (22.6) over Vanderbilt (18.1) by 4.5 points on a neutral field. After adding home field advantage, the rating-implied line may differ meaningfully from the market spread. Texas brings a meaningful home field advantage to this matchup (Blue Chip HFA: 2.9). Add this to the neutral-site differential to arrive at a venue-adjusted line.
Blue Chip Analytics power ratings represent expected point margin against an average FBS opponent on a neutral field, calculated from game data sourced via CollegeFootballData.com (CFBD). They are one input: cross-reference with the travel, rest, and weather data above before drawing conclusions.
Texas won and Vanderbilt covered the spread.


