SMU defeated Stanford 34–10 to secure a comfortable win. SMU covered by 4.5; Game went Under by 11.5.
Adjust any factor to update your projected line
Positive adjustment = favours home team
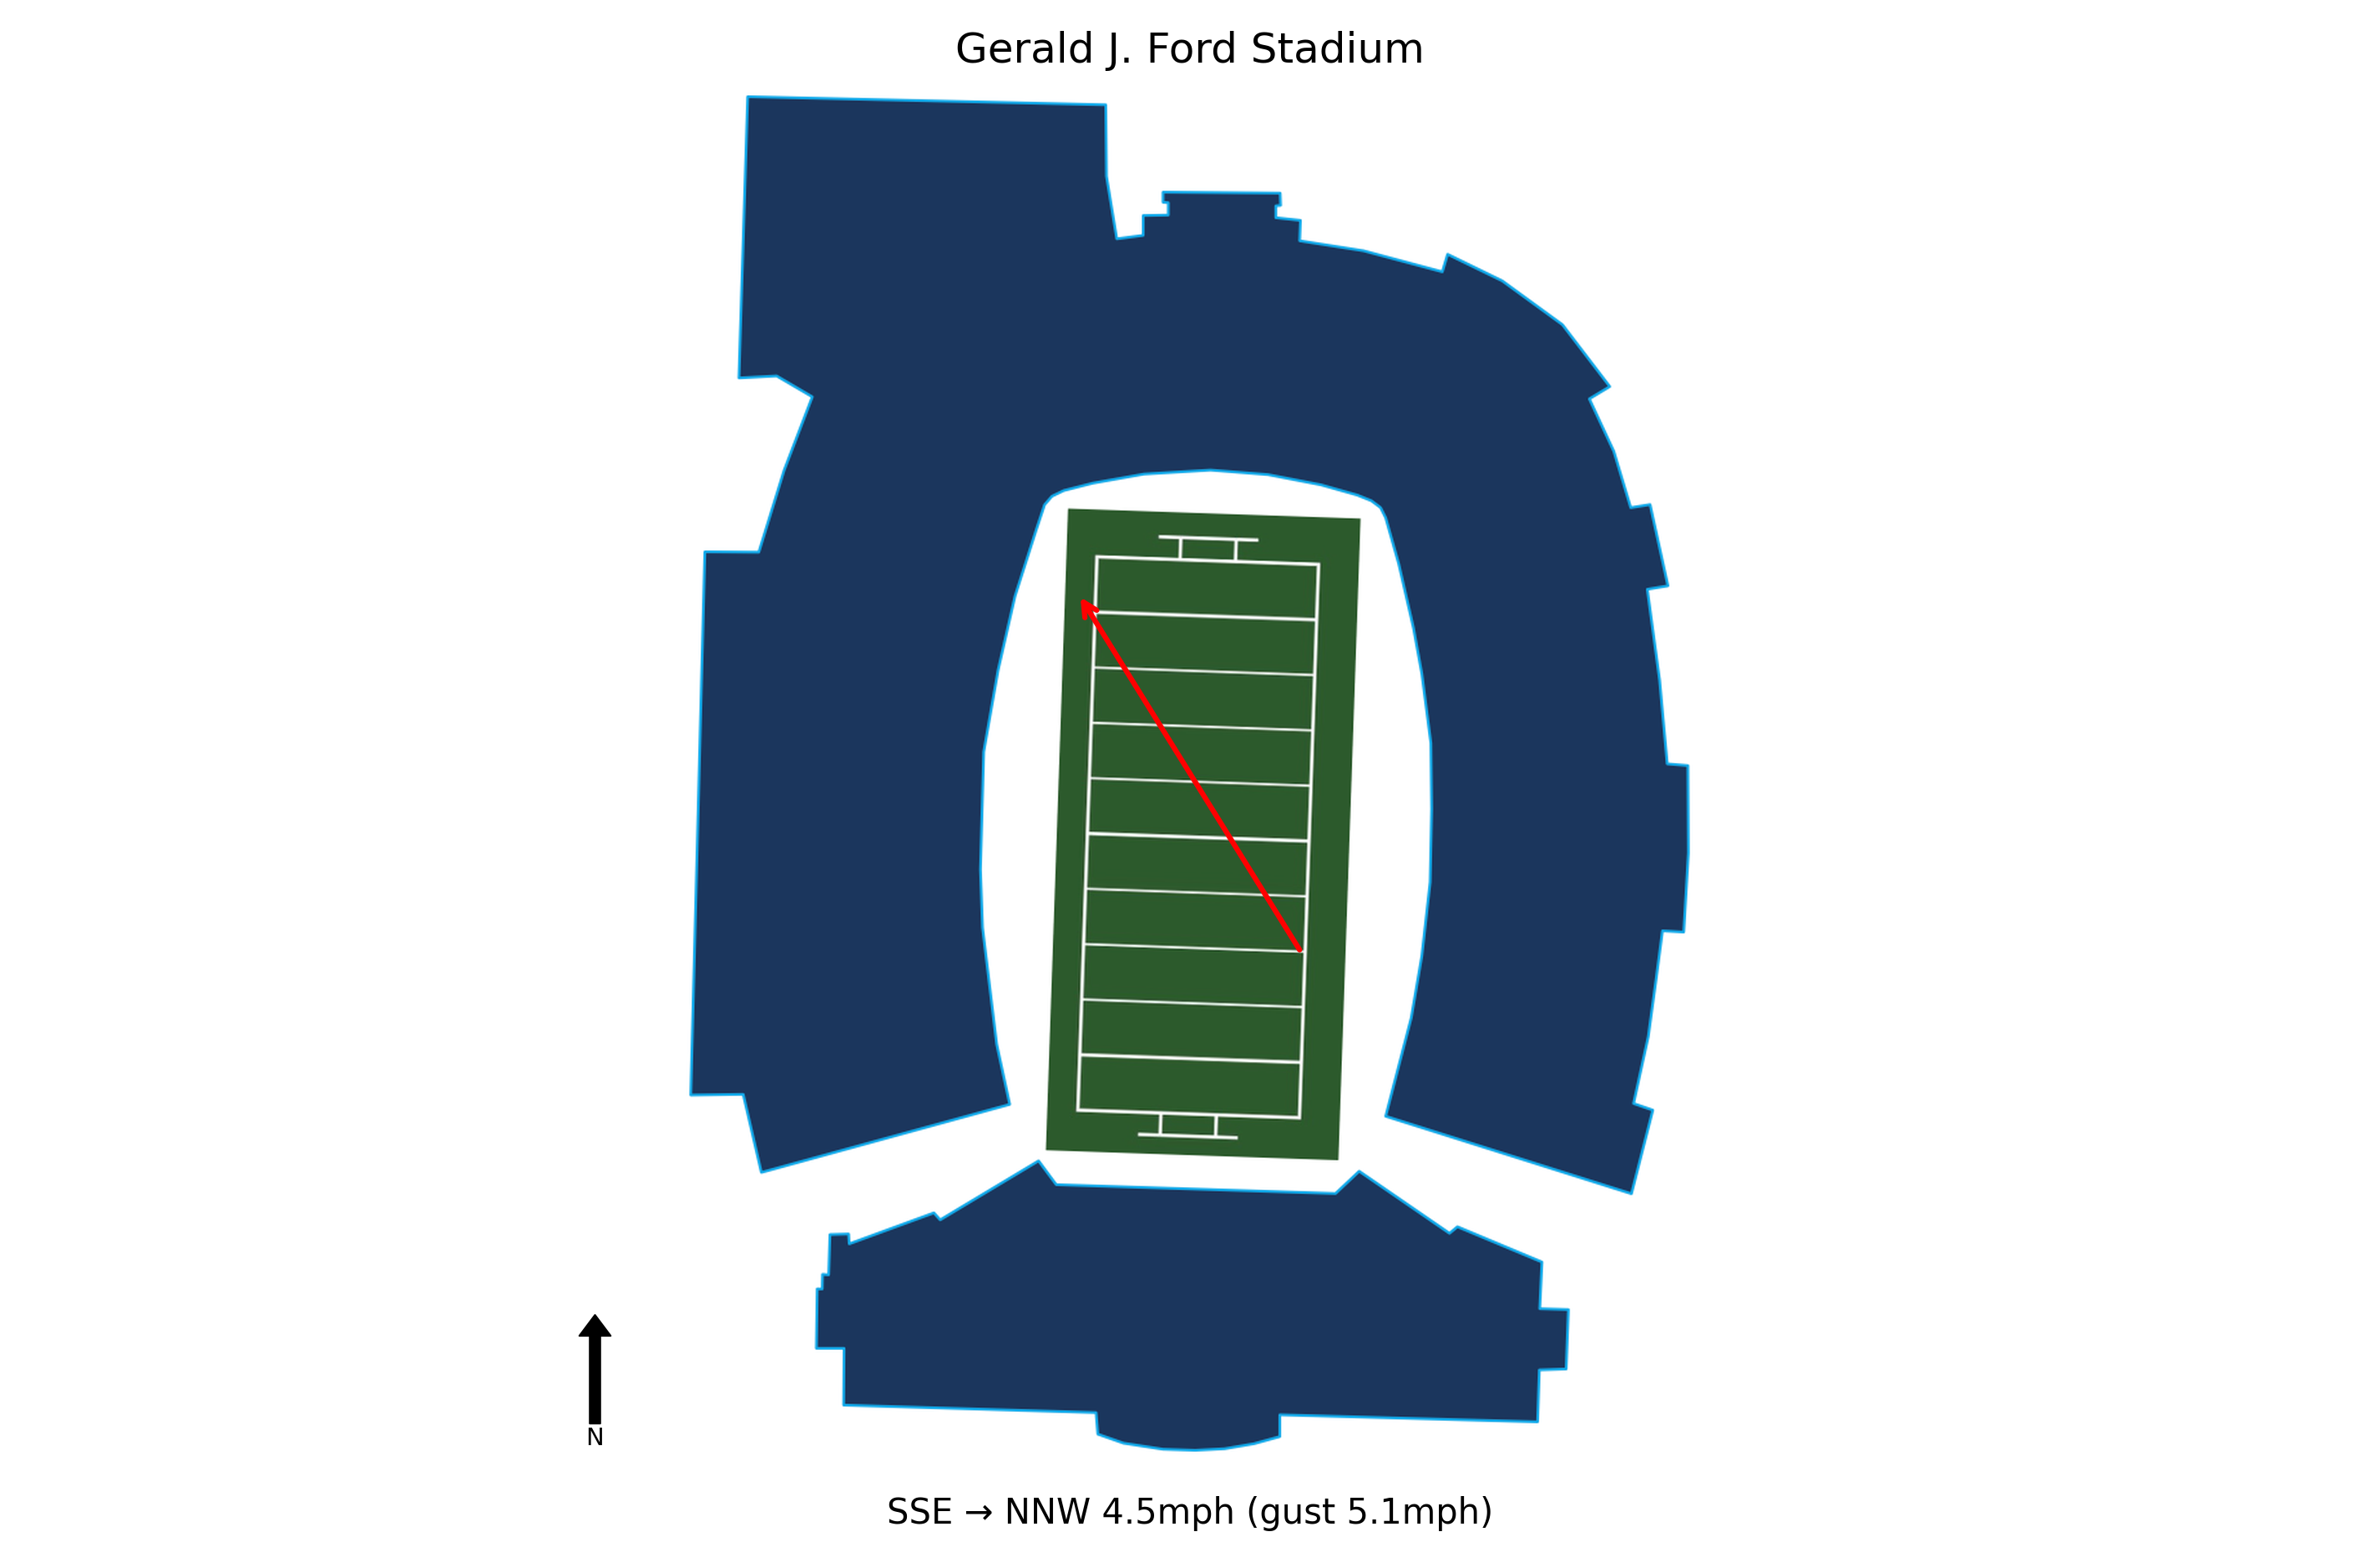
At kick-off, conditions at Gerald J. Ford Stadium were Sunny, 92.5°F, Heat Index 91.4°F with winds of 4.5 mph. Weather is not expected to be a meaningful factor in this game. Historical weather data for this game is preserved in the panel below.

92.5°F
Stanford's offense allowed six sacks and quarterback Ben Gulbranson was under constant pressure, leading to a critical 96-yard pick-six that sealed the game. This indicates a vulnerability against aggressive defensive lines.
Despite the loss, Stanford showed ability to respond quickly, driving 75 yards in 33 seconds to score a touchdown just before halftime. This suggests the offense can execute efficiently when given time.
The defense gave up an 87-yard rushing touchdown and a 42-yard receiving score, highlighting a susceptibility to explosive plays that could be exploited by future opponents.
Cornerback Aaron Morris was immobilized and taken to the hospital after a tackle but cleared tests and rejoined the team. His status for next week is uncertain, which could affect the secondary against Florida State.
Interim coach Frank Reich expressed belief that Stanford is not outclassed by SMU, indicating a mindset that could motivate the team but also a need to address execution gaps before facing ranked opponents.
SMU's defense forced a 96-yard pick-6 and recorded six sacks, showcasing their ability to create game-changing plays and pressure the quarterback. This defensive performance was crucial in securing the win and will be a key factor against Clemson.
Chris Johnson Jr. broke out with an 87-yard rushing touchdown and a 42-yard receiving score, demonstrating big-play capability. His emergence adds a dynamic element to the offense that Clemson must account for.
Quarterback Kevin Jennings completed 22 of 30 passes for 247 yards and two touchdowns, showing accuracy and the ability to extend plays. His poise under pressure will be vital against Clemson's defense.
SMU extended its regular-season ACC winning streak to 10 games, proving they belong in a power conference. This confidence and momentum could carry over into the tough matchup at Clemson.
SMU faces a formidable Clemson team on the road next week. The Mustangs will need to replicate their defensive pressure and explosive offense to compete against a top-tier opponent.
Stanford travels 1,467 miles to this game, a significant road trip.
Stanford arrives with a 2-hour body clock disadvantage.
SMU won by 24 to secure a comfortable win.
SMU covered the spread.
The total went Under by 11.5 points.
Blue Chip Analytics power ratings favour SMU (11.4) over Stanford (-3.0) by 14.4 points on a neutral field. After adding home field advantage, the rating-implied line may differ meaningfully from the market spread. SMU brings one of the stronger home environments in the FBS to this matchup (Blue Chip HFA: 3.2). Add this to the neutral-site differential to arrive at a venue-adjusted line.
Blue Chip Analytics power ratings represent expected point margin against an average FBS opponent on a neutral field, calculated from game data sourced via CollegeFootballData.com (CFBD). They are one input: cross-reference with the travel, rest, and weather data above before drawing conclusions.
SMU won and SMU covered the spread.


