Duke defeated California 45–21 to secure a comfortable win. Duke covered by 20.5; Game went Over by 11.5.
Adjust any factor to update your projected line
Positive adjustment = favours home team
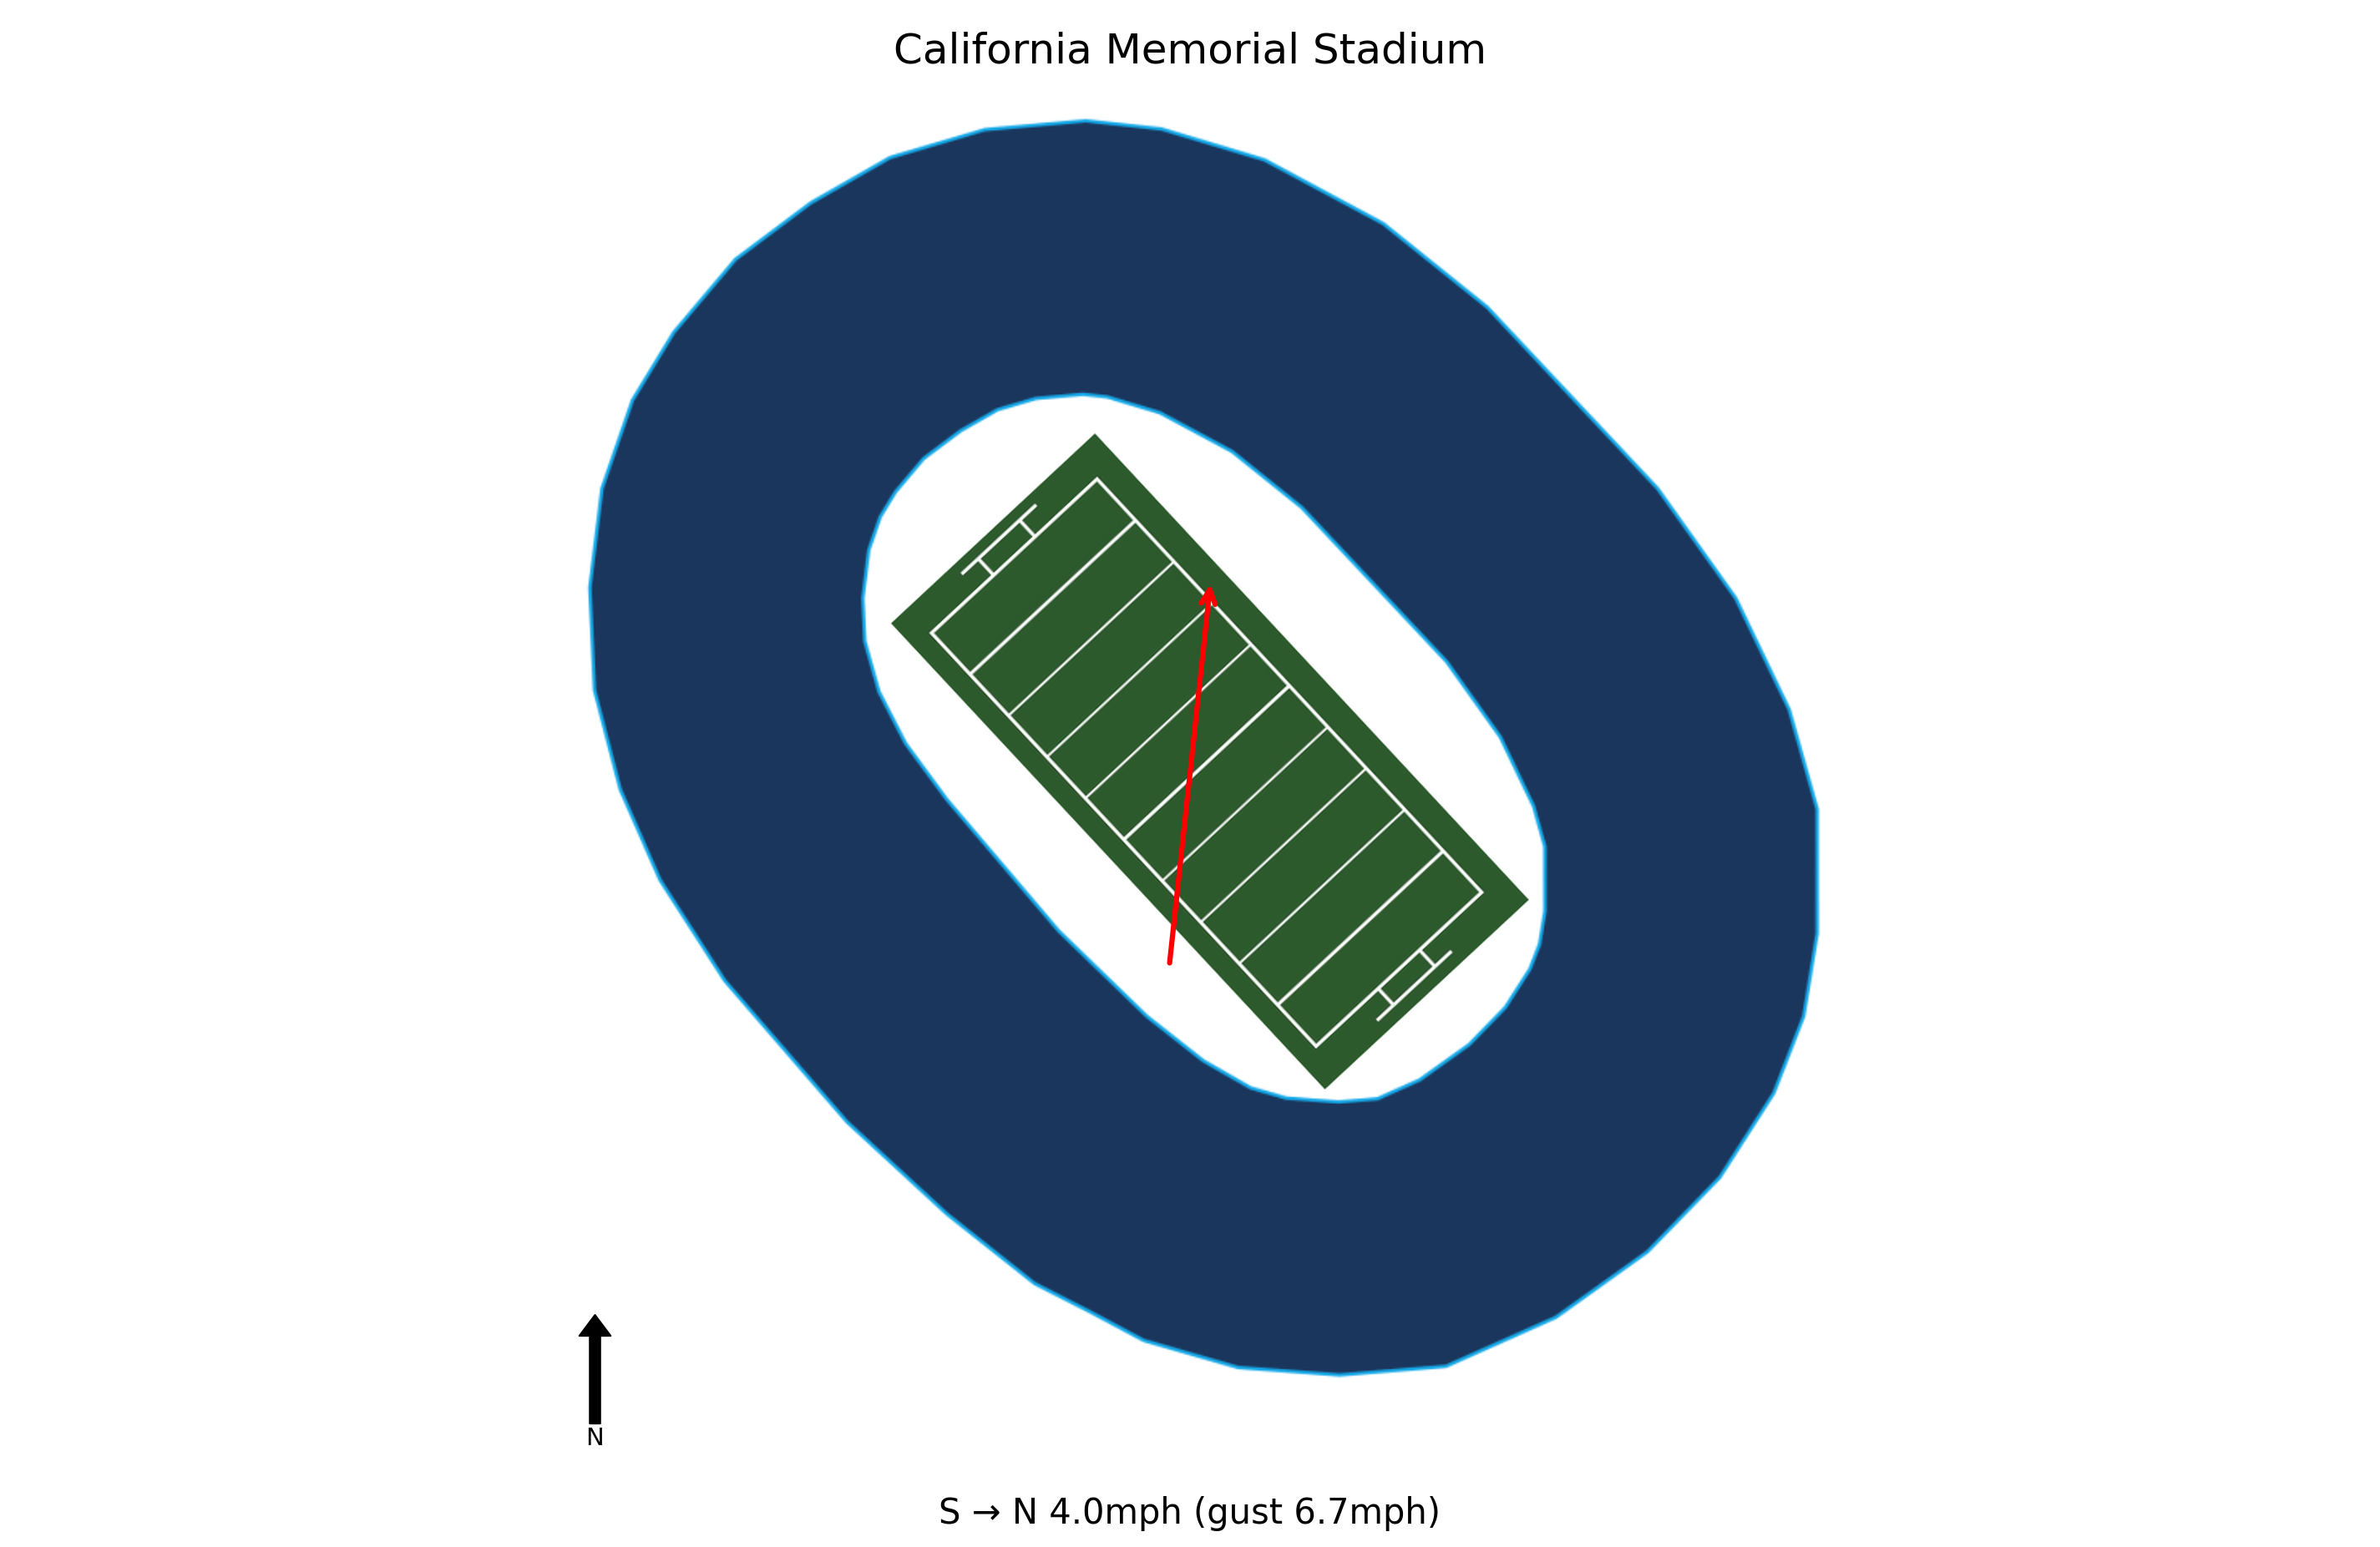
At kick-off, conditions at California Memorial Stadium were Mist, 56.5°F, Feels Like 55.6°F with winds of 4.0 mph. Weather is not expected to be a meaningful factor in this game. Historical weather data for this game is preserved in the panel below.

56.5°F
Duke fell behind 14-0 in the first quarter but responded with four consecutive scoring drives, including three touchdowns in a 6.5-minute span in the second quarter, showing strong composure and ability to adjust.
Mensah threw for 265 yards and two touchdowns, leading the up-tempo offense to 45 points against a Cal defense that had been allowing only 18 points per game, indicating his growing confidence and effectiveness.
Duke's defense recorded three interceptions and six sacks, stifling Cal's passing game and limiting their ground attack, which will be crucial against a strong Georgia Tech offense.
Nate Sheppard and Anderson Castle each ran for two touchdowns, and Jaquez Moore added another, showcasing a deep running back corps that can control the game and keep pressure off the quarterback.
Duke has won three straight ACC games, improving to 4-2 overall and 3-0 in conference play, building confidence and momentum heading into a tough matchup against No. 17 Georgia Tech.
Quarterback Jaron-Keawe Sagapolutele threw three interceptions, which directly led to Duke's scoring drives and the team's inability to maintain momentum.
Coach Justin Wilcox noted the team's roller-coaster play, with glimpses of good football but an overall lack of consistency, as they have lost two of their last three games.
California's rushing attack was ineffective, allowing Duke's defense to focus on stopping the passing game, which contributed to the offensive imbalance.
After allowing an average of 18 points per game, the defense gave up 45 points, including three touchdowns in a 6.5-minute span in the second quarter, indicating a significant breakdown.
California hosts North Carolina on Oct. 17, needing to address turnover issues and establish a more balanced offense to compete effectively.
Duke travels 2,379 miles to this game, a cross-country trip.
Duke arrives with a 3-hour body clock disadvantage.
Duke won by 24 to secure a comfortable win.
Duke covered the spread comfortably.
The total went Over by 11.5 points.
Blue Chip Analytics power ratings favour Duke (8.1) over California (-2.3) by 10.4 points on a neutral field. Despite playing at home, California faces a power rating deficit. Check whether the market spread accounts for this gap. California brings a meaningful home field advantage to this matchup (Blue Chip HFA: 2.5). Add this to the neutral-site differential to arrive at a venue-adjusted line.
Blue Chip Analytics power ratings represent expected point margin against an average FBS opponent on a neutral field, calculated from game data sourced via CollegeFootballData.com (CFBD). They are one input: cross-reference with the travel, rest, and weather data above before drawing conclusions.
Duke won and Duke covered the spread.


