LSU defeated SE Louisiana 56–10 in a dominant performance. SE Louisiana covered by 2.5; Game went Over by 5.5.
Adjust any factor to update your projected line
Positive adjustment = favours home team
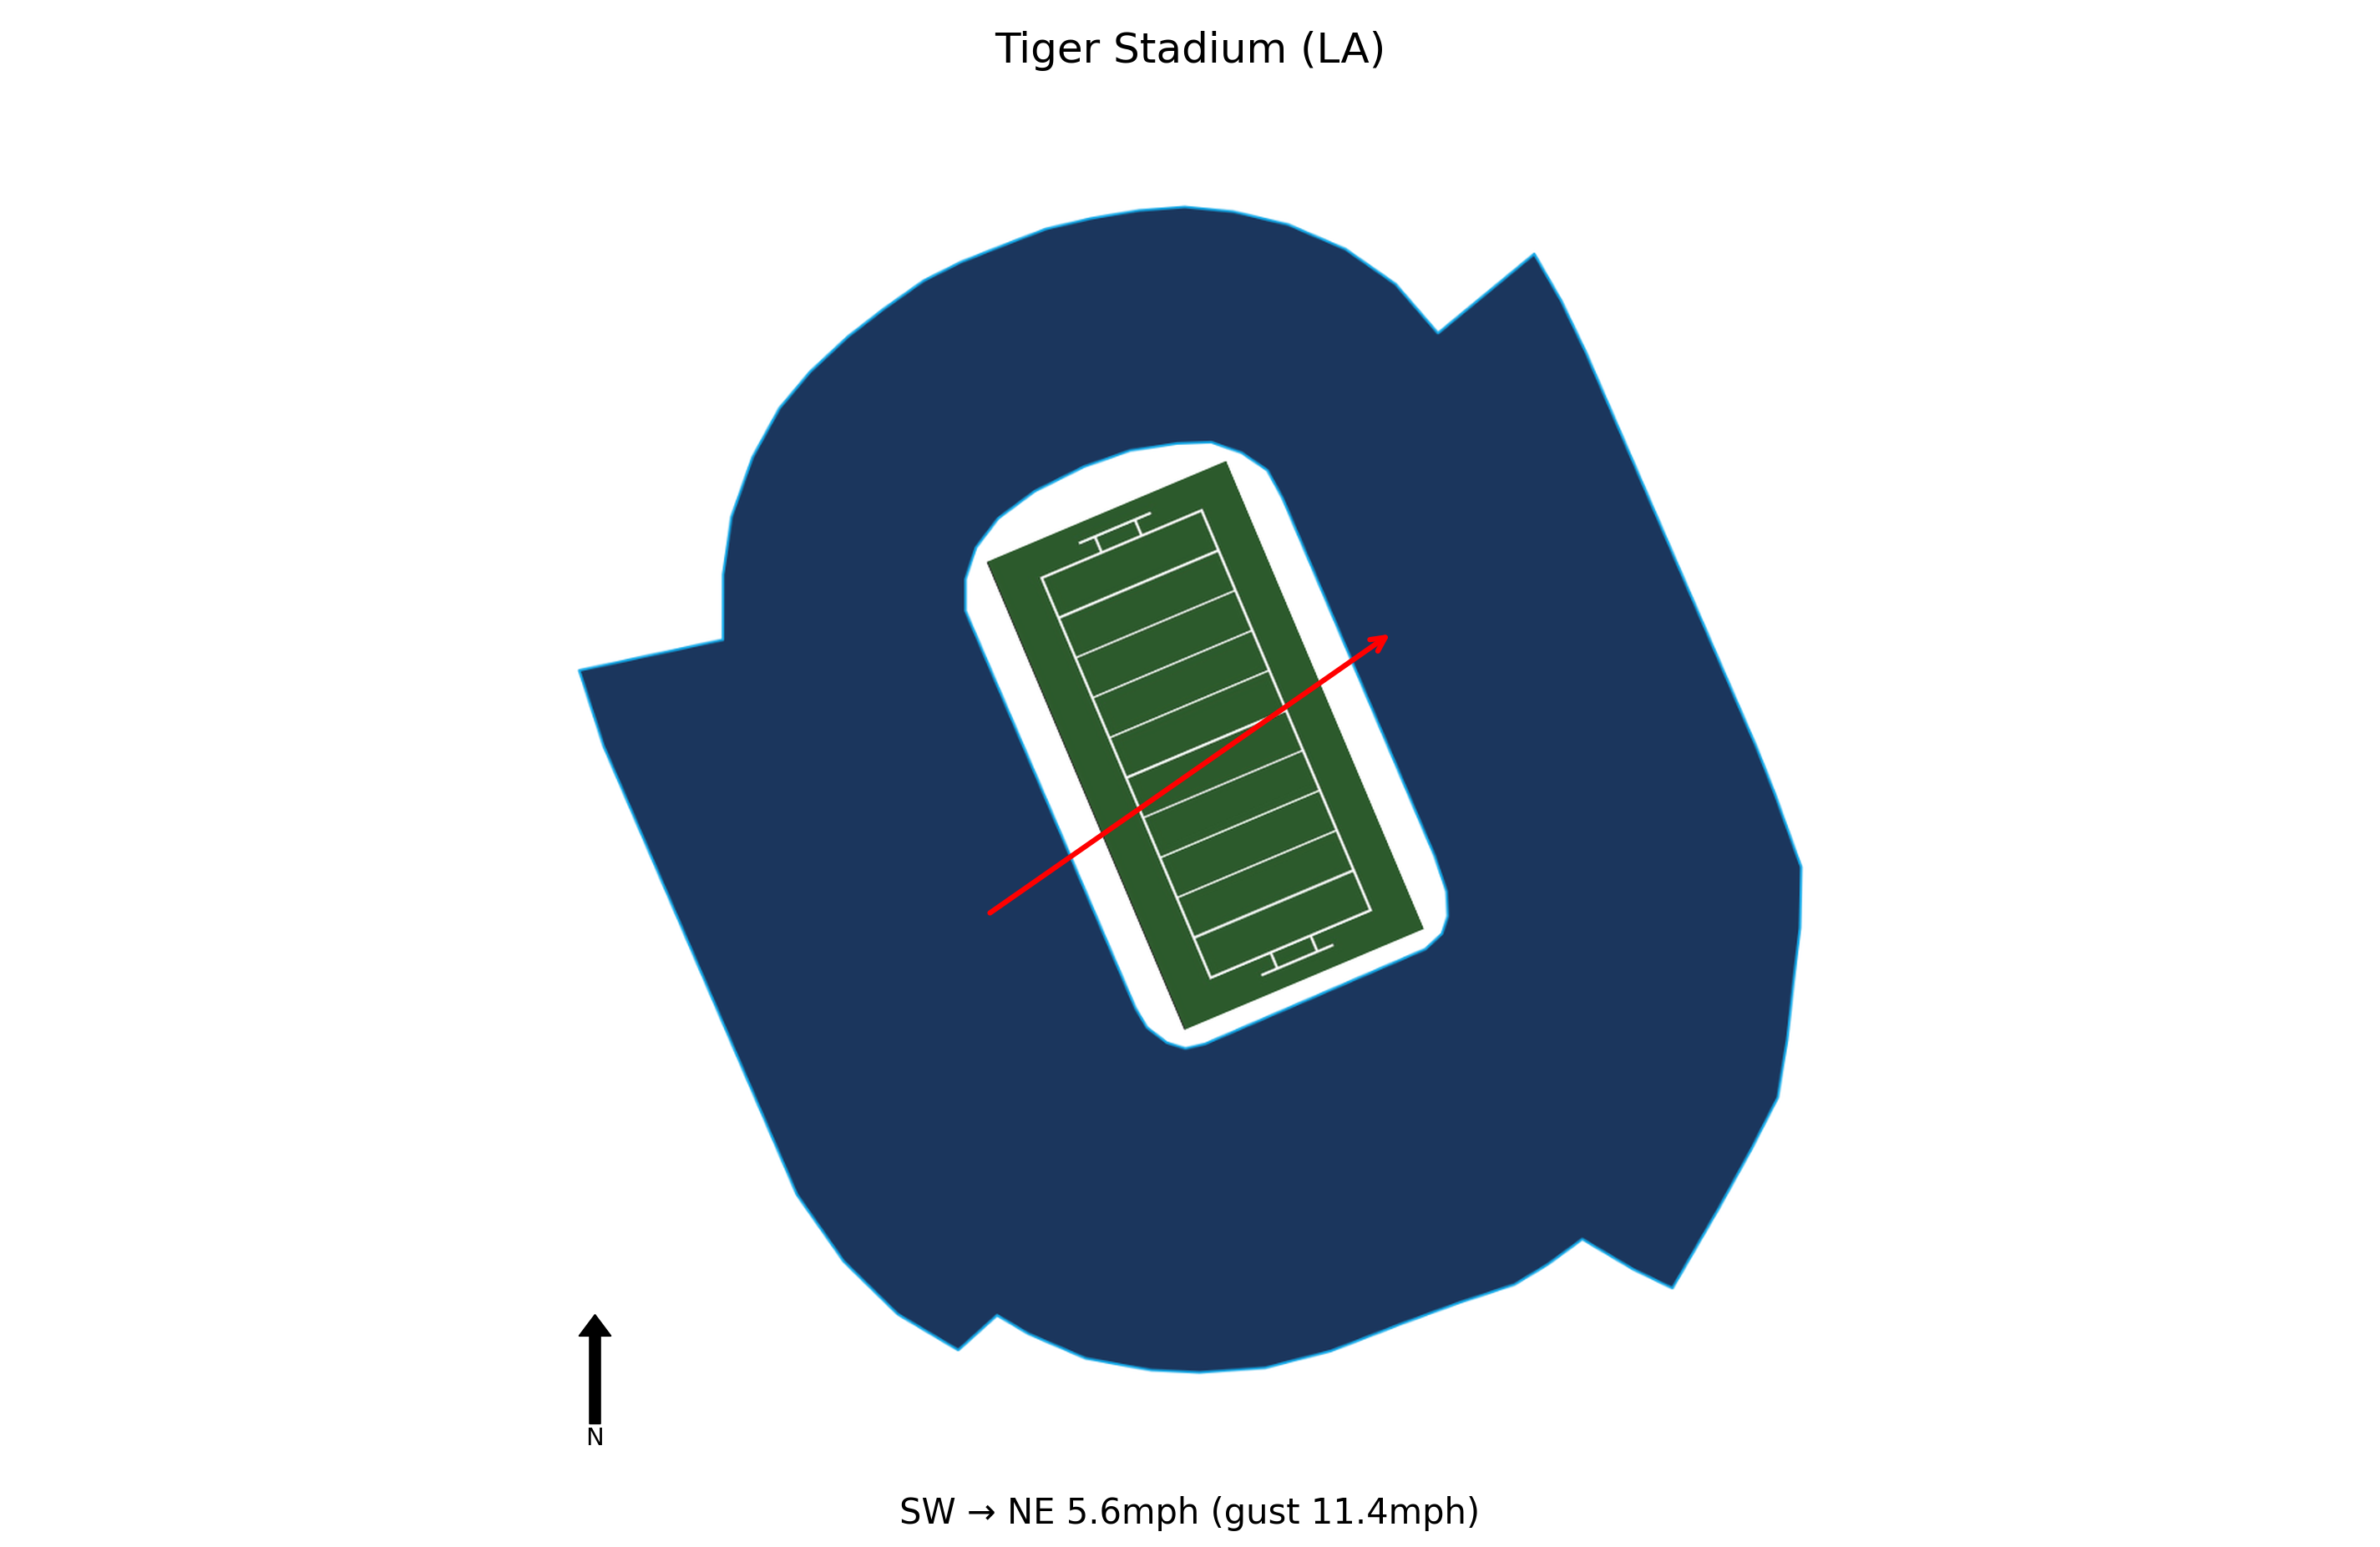
At kick-off, conditions at Tiger Stadium (LA) were Clear, 80.2°F, Heat Index 83.3°F with winds of 5.6 mph. Weather is not expected to be a meaningful factor in this game. Historical weather data for this game is preserved in the panel below.

80.2°F
Southeastern Louisiana managed only 30 yards of total offense in the first half and struggled to sustain drives, gaining just two first downs before halftime. The Lions' offense was stifled by LSU's starting defense, which held them scoreless until the third quarter when most LSU starters were on the sidelines.
Southeastern Louisiana's only touchdown of the game came midway through the third quarter on a 14-yard pass from Carson Camp to Deantre Jackson, but this occurred after LSU had pulled most of its starting defense. This suggests the Lions' offense may struggle against stronger defensive units.
The Lions managed to keep the game close for the first quarter, trailing only 7-0, but were overwhelmed by LSU's 28-point second quarter. This pattern of early competitiveness followed by a collapse could be a concern for upcoming games, especially against teams with explosive offenses.
Southeastern Louisiana will host UTRGV next Saturday. This game presents an opportunity for the Lions to rebound and address offensive and defensive issues exposed by LSU, particularly in maintaining consistency throughout the game.
SE Louisiana travels 43 miles to this game, a short road trip.
LSU won by 46 in a dominant performance.
SE Louisiana covered the spread narrowly.
The total went Over by 5.5 points.
Blue Chip Analytics power ratings favour LSU (12.8) over SE Louisiana (-17.8) by 30.6 points on a neutral field. After adding home field advantage, the rating-implied line may differ meaningfully from the market spread. LSU brings one of the stronger home environments in the FBS to this matchup (Blue Chip HFA: 3.0). Add this to the neutral-site differential to arrive at a venue-adjusted line.
Blue Chip Analytics power ratings represent expected point margin against an average FBS opponent on a neutral field, calculated from game data sourced via CollegeFootballData.com (CFBD). They are one input: cross-reference with the travel, rest, and weather data above before drawing conclusions.
LSU won and SE Louisiana covered the spread.


