Georgia defeated Tennessee 44–41 in a nail-biter. Tennessee covered by 0.5; Game went Over by 34.5.
Adjust any factor to update your projected line
Positive adjustment = favours home team
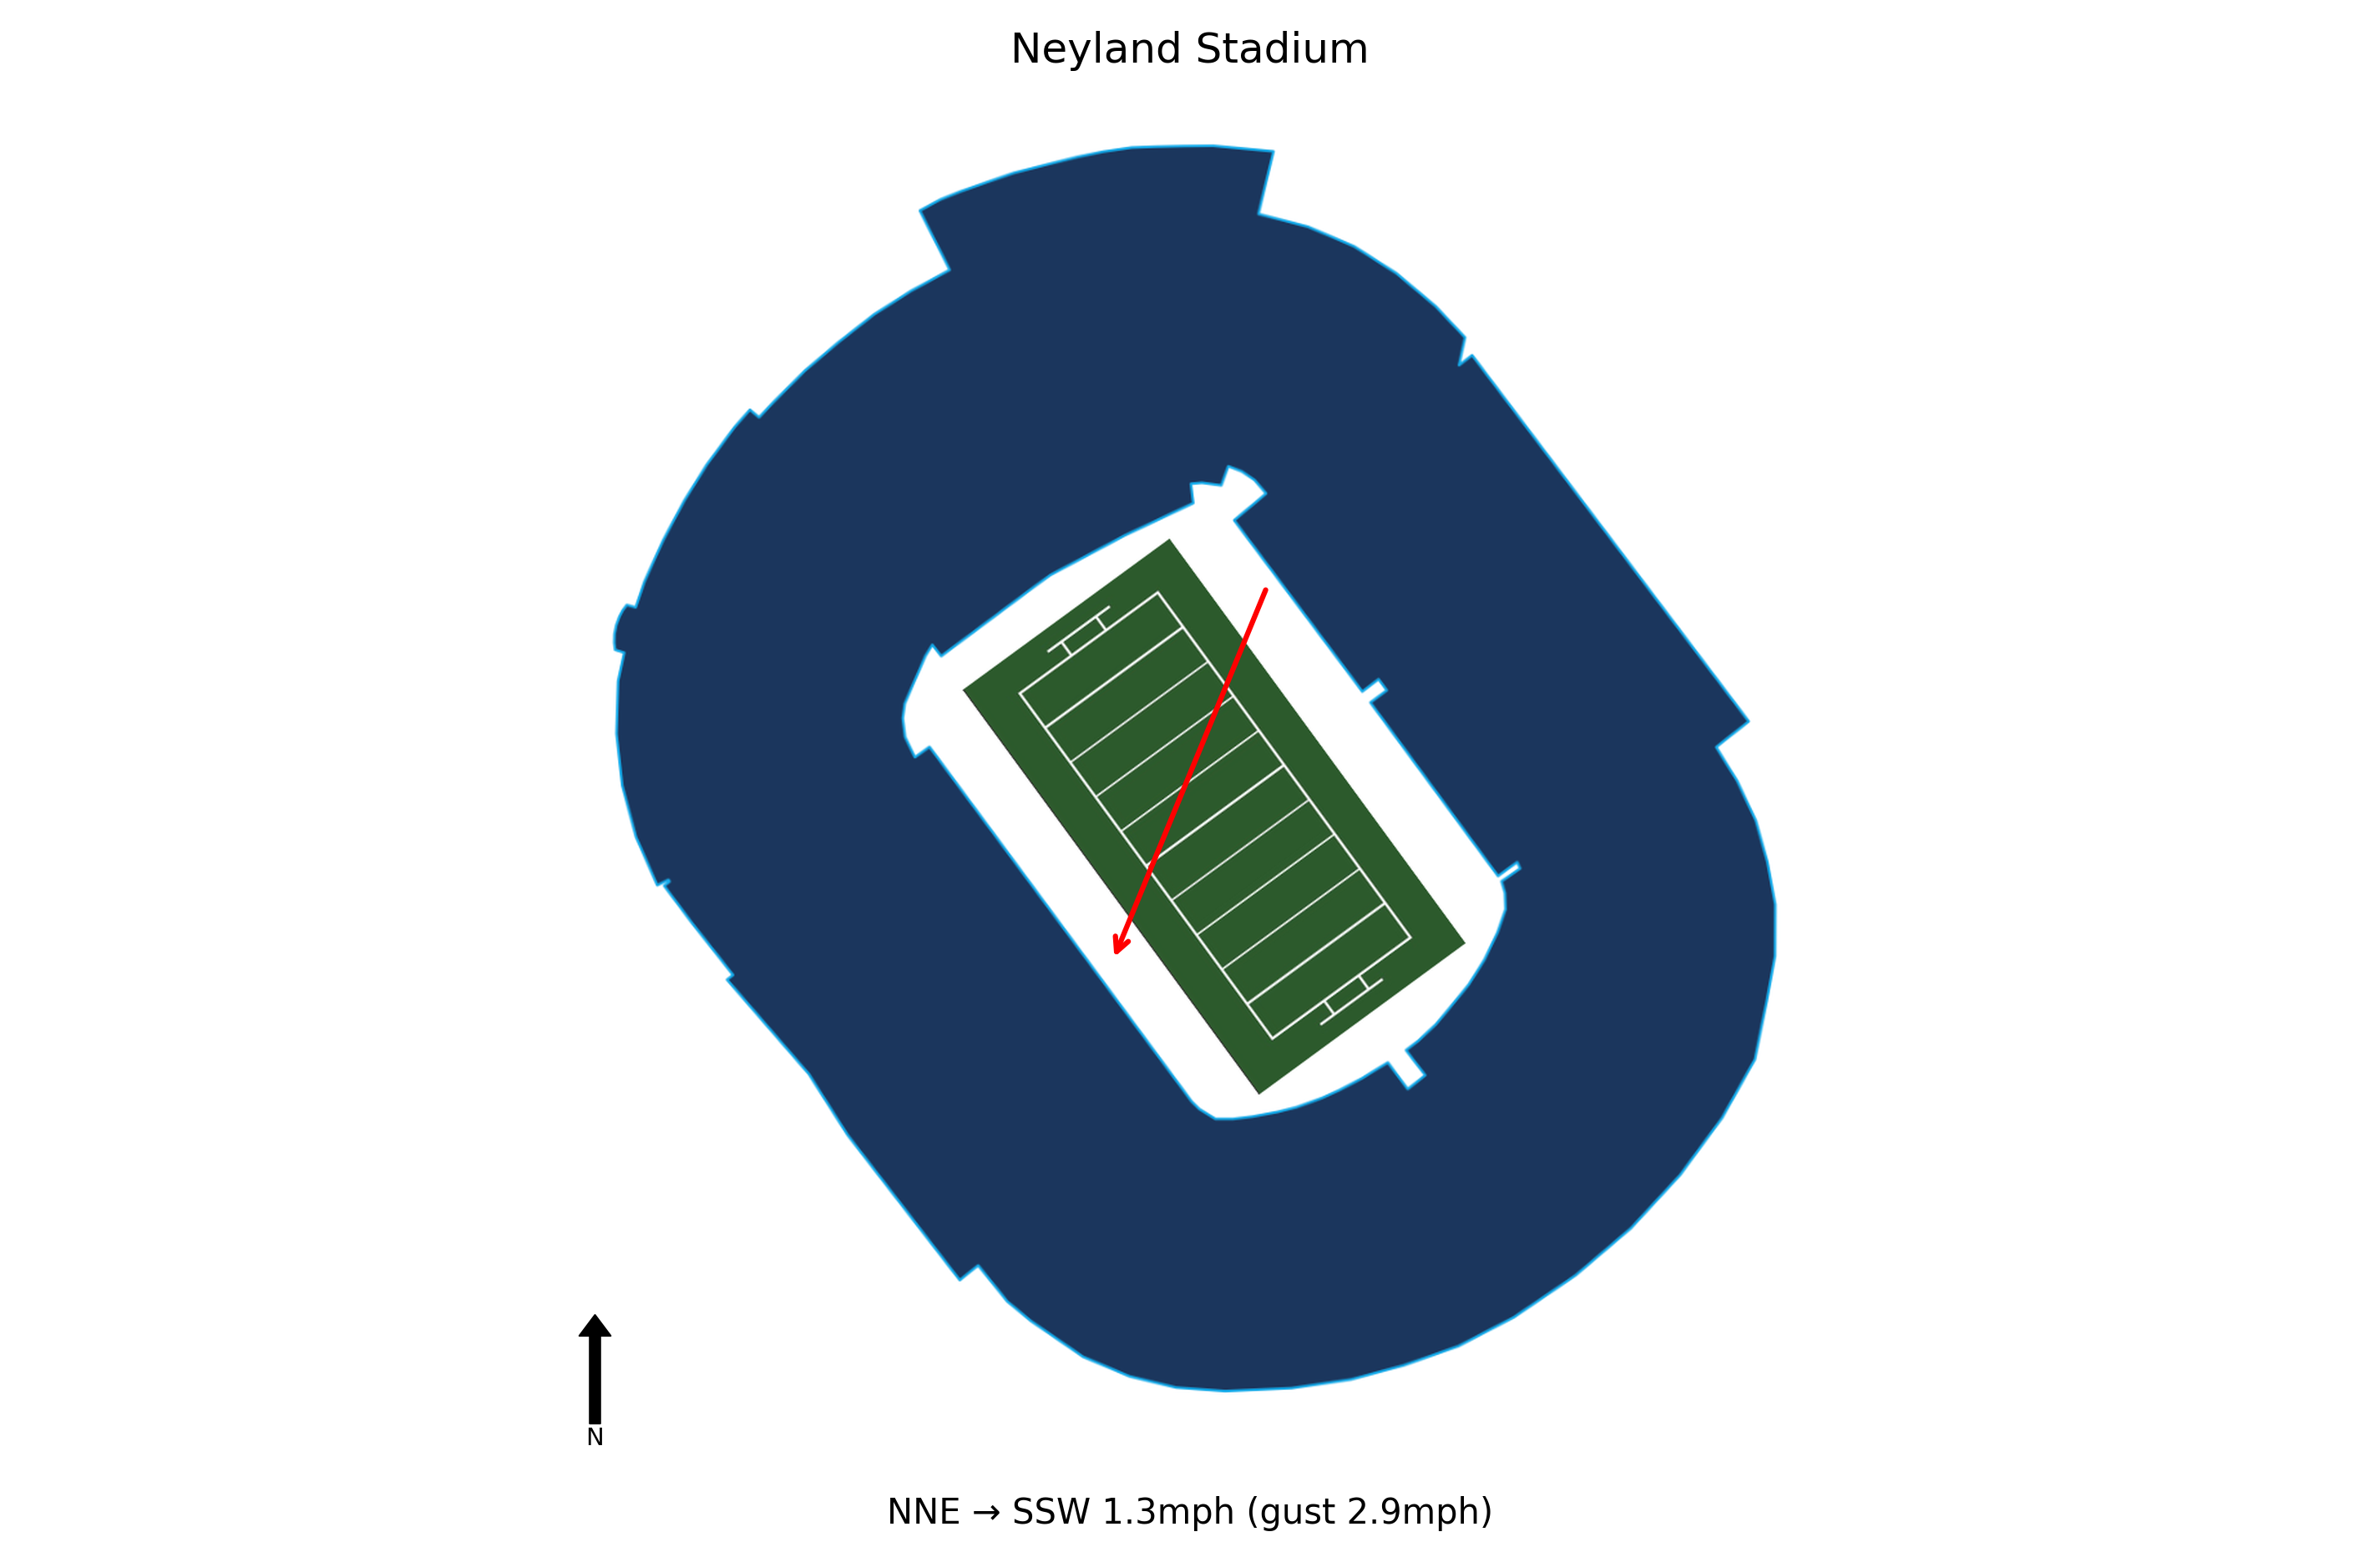
At kick-off, conditions at Neyland Stadium were Sunny, 75.2°F, Feels Like 76.8°F with winds of 1.3 mph. Weather is not expected to be a meaningful factor in this game. Historical weather data for this game is preserved in the panel below.

75.2°F
Georgia overcame three deficits, including a 14-point first-quarter hole, to win 44-41 in overtime. This shows the team's mental toughness and ability to perform under pressure, which will be crucial in future close games.
Quarterback Gunner Stockton threw for 304 yards and two touchdowns, also rushing for a TD. The offense finally executed as planned, with success in the power game, setting a positive trajectory for the next game.
Georgia's secondary frustrated Tennessee's passing game, limiting big plays after the first quarter. This defensive strength will be key against Alabama's potent offense in the next game.
Josh McCray's 1-yard OT touchdown and Nate Frazier's 21-yard run set up the win. London Humphreys caught a crucial fourth-down fade for a tying touchdown. These performances indicate reliable playmakers in critical situations.
Georgia has an open date next week before hosting Alabama on Sept. 27. This extra time allows for rest, preparation, and game-planning for a top-tier opponent, potentially giving them an edge.
Tennessee's offense, led by QB Joey Aguilar (371 yards, 4 TDs passing, 1 rushing TD), was explosive, especially in the first quarter with a 21-7 lead. However, the defense allowed Georgia to rally from three deficits, including a game-tying drive in the final minutes, highlighting a need for improved late-game execution.
Kicker Max Gilbert missed a 43-yard field goal as time expired in regulation that would have won the game, then made a 42-yarder in overtime but it wasn't enough. This underscores the volatility of special teams and the importance of reliable kicking in close games.
Despite the loss, Tennessee showed resilience by coming from behind twice in the second half. However, the defeat eliminates their margin for error in playoff hopes, meaning they must win out to stay in contention.
Chris Brazzell III had a huge game with three touchdown catches (72, 14, 66 yards), and Braylon Staley added a 32-yard TD. This receiving corps is a major strength, but they need consistent production to offset defensive struggles.
Tennessee hosts UAB next Saturday, a non-conference game that should be a bounce-back opportunity. The Vols will look to correct defensive issues and build momentum before tougher SEC games ahead.
Georgia travels 142 miles to this game, a short road trip.
Georgia won by 3 in a nail-biter.
Tennessee covered the spread narrowly.
The total went Over by 34.5 points.
Blue Chip Analytics power ratings favour Georgia (18.8) over Tennessee (18.0) by 0.8 points on a neutral field. Despite playing at home, Tennessee faces a power rating deficit. Check whether the market spread accounts for this gap. Tennessee brings one of the stronger home environments in the FBS to this matchup (Blue Chip HFA: 3.1). Add this to the neutral-site differential to arrive at a venue-adjusted line.
Blue Chip Analytics power ratings represent expected point margin against an average FBS opponent on a neutral field, calculated from game data sourced via CollegeFootballData.com (CFBD). They are one input: cross-reference with the travel, rest, and weather data above before drawing conclusions.
Georgia won and Tennessee covered the spread.


