UNLV defeated UCLA 30–23 in a one-score game. UNLV covered by 9.5; Game went Under by 1.5. Blue Chip Analytics had rated UCLA 7.4 points stronger on a neutral field.
Adjust any factor to update your projected line
Positive adjustment = favours home team
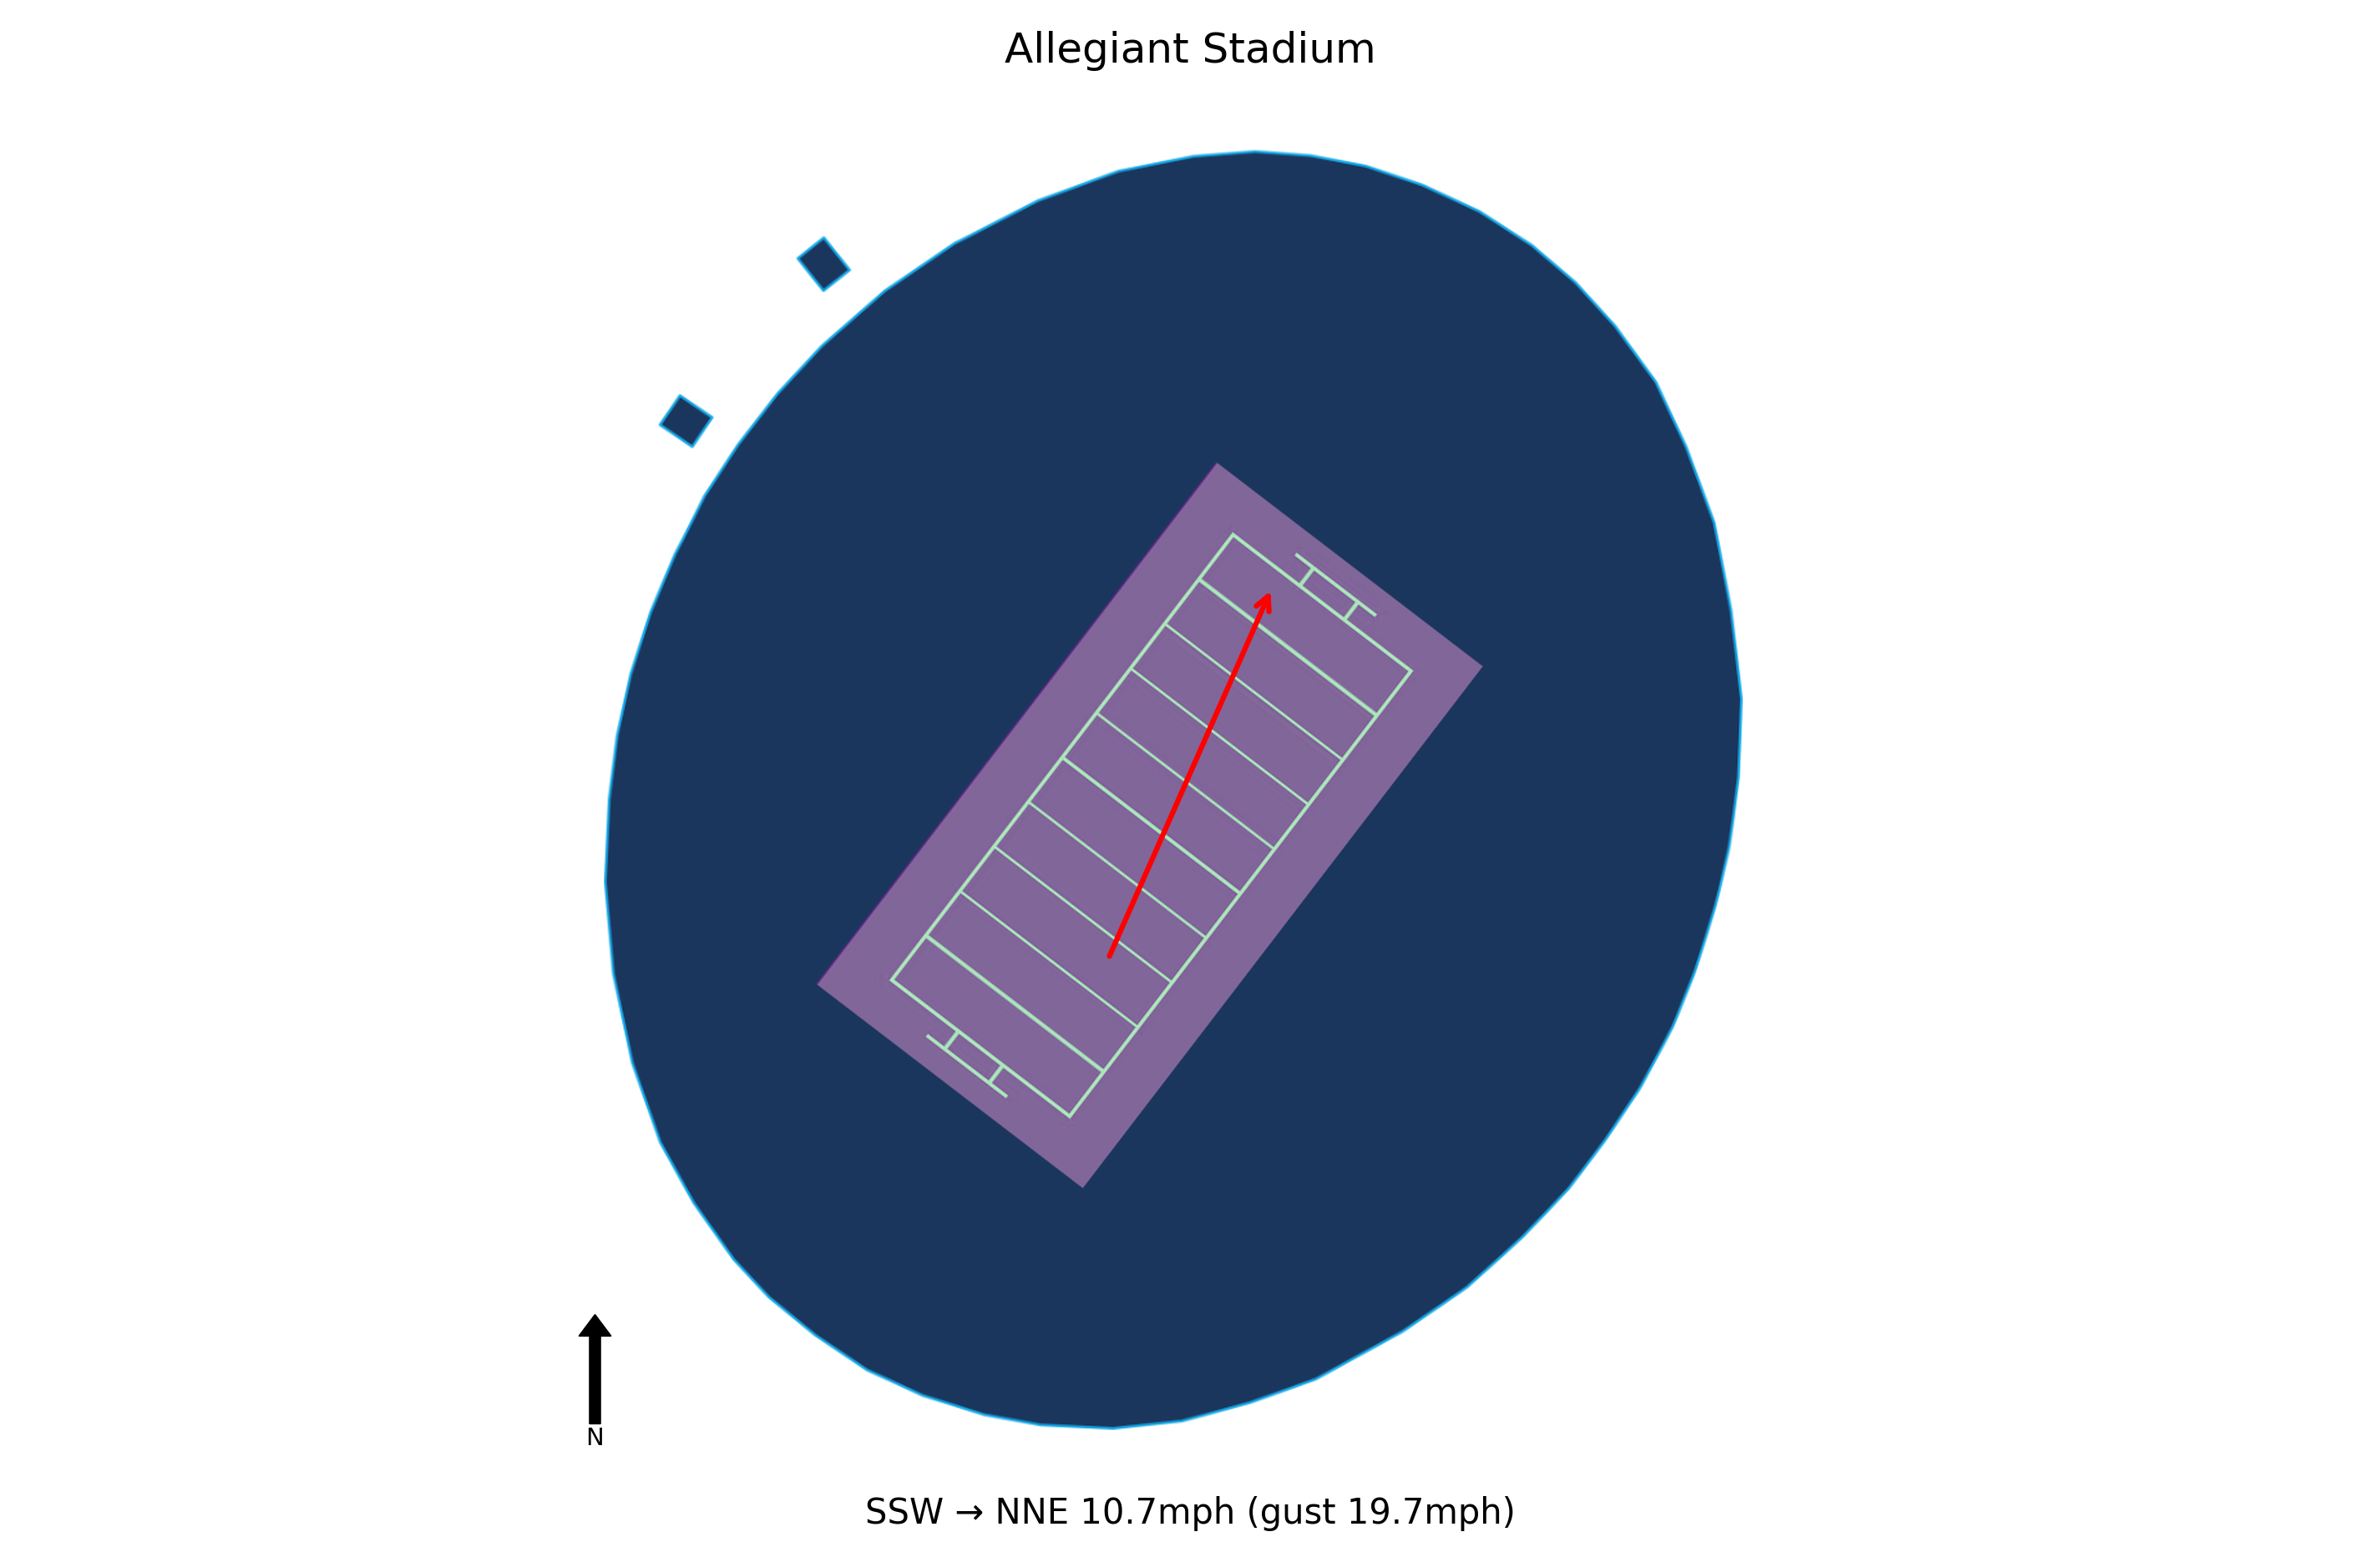
This game was played indoors at Allegiant Stadium in a climate-controlled environment. Weather was not a factor.
~72°F
UCLA fell behind 23-0 late in the first half, being outgained 250-110 yards, and despite a second-half rally (outscoring UNLV 20-7), the early deficit proved insurmountable.
UCLA committed 14 accepted penalties for 129 yards, contributing to a 3-hour 52-minute game and hindering their ability to sustain drives or stop UNLV.
After a short field goal just before halftime, UCLA outscored UNLV 20-7 in the second half, showing resilience that could carry over into upcoming winnable games against New Mexico and Northwestern.
Nico Iamaleava completed 29 of 41 passes for 255 yards with a touchdown and an interception, but the offense struggled in the first half, managing only 110 total yards before the break.
UCLA hosts New Mexico on Friday in a game that looks winnable, but the Bruins must address their slow starts and penalty issues to avoid another upset.
UNLV defeated UCLA 30-23, marking their first victory over a Big Ten opponent in 22 years, which boosts program confidence and national recognition.
The Rebels built a 23-0 lead by halftime, outgaining UCLA 250-110 yards, showcasing strong execution and offensive efficiency under QB Anthony Colandrea.
UNLV did not commit a turnover, extending their Mountain West-record streak to 17 games with one or zero turnovers, a key factor in their success.
The Rebels were flagged 13 times for 129 yards, nearly costing them the game as UCLA rallied in the second half; discipline needs improvement.
UNLV visits Miami (Ohio) on Sept. 20 to close nonconference play; their strong start and turnover margin suggest they are favorites, but penalty reduction is critical.
UCLA travels 215 miles to this game, a short road trip.
UNLV won by 7 in a one-score game.
UNLV covered the spread by a solid margin.
The total went Under by 1.5 points.
Blue Chip Analytics power ratings favour UCLA (1.7) over UNLV (-5.7) by 7.4 points on a neutral field. Despite playing at home, UNLV faces a power rating deficit. Check whether the market spread accounts for this gap. UNLV brings a meaningful home field advantage to this matchup (Blue Chip HFA: 2.9). Add this to the neutral-site differential to arrive at a venue-adjusted line.
Blue Chip Analytics power ratings represent expected point margin against an average FBS opponent on a neutral field, calculated from game data sourced via CollegeFootballData.com (CFBD). They are one input: cross-reference with the travel, rest, and weather data above before drawing conclusions.
UNLV won and UNLV covered the spread.


