Ohio defeated West Virginia 17–10 in a one-score game. Ohio covered by 10.5; Game went Under by 31.5.
Adjust any factor to update your projected line
Positive adjustment = favours home team
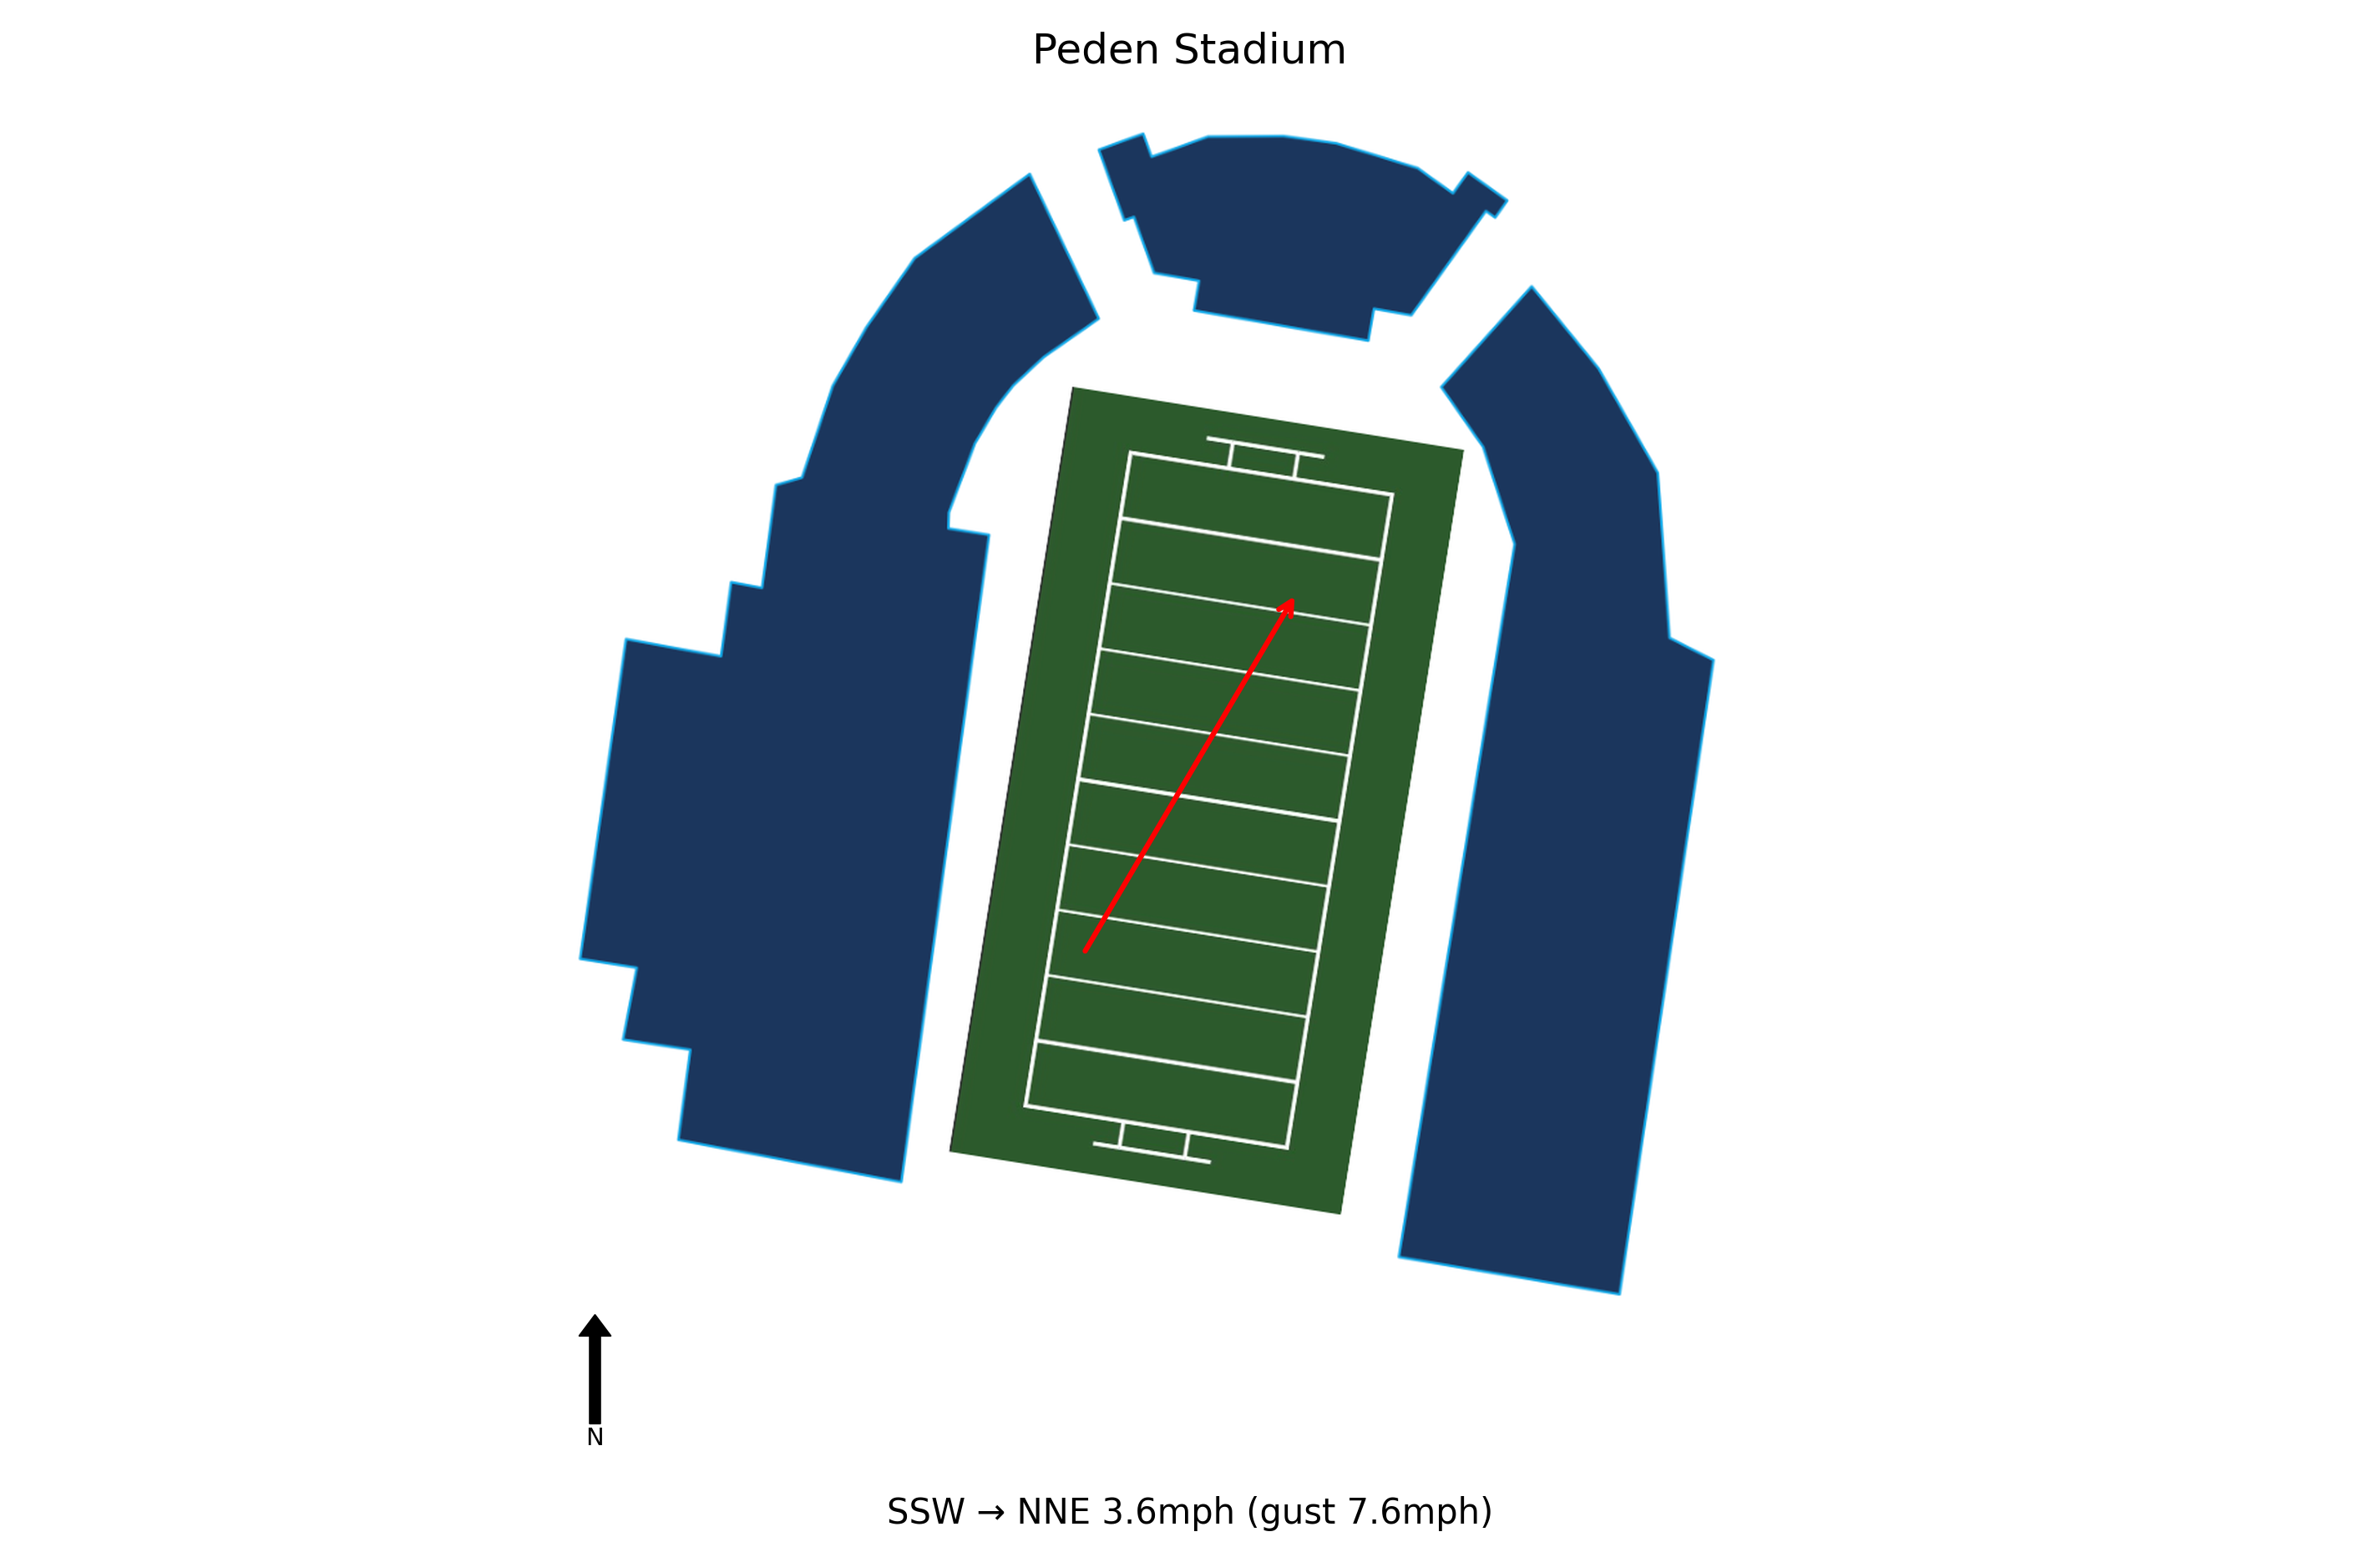
At kick-off, conditions at Peden Stadium were Clear, 58.6°F, Feels Like 58.8°F with winds of 3.6 mph. Weather is not expected to be a meaningful factor in this game. Historical weather data for this game is preserved in the panel below.

58.6°F
West Virginia travels 117 miles to this game, a short road trip.
Ohio won by 7 in a one-score game.
Ohio covered the spread by a solid margin.
The total went Under by 31.5 points.
Blue Chip Analytics power ratings rate West Virginia (-2.8) and Ohio (-2.9) as essentially equal on a neutral field. In this range, HFA, travel, rest, and weather context carry more weight than the raw rating differential. Ohio brings a meaningful home field advantage to this matchup (Blue Chip HFA: 2.7). Add this to the neutral-site differential to arrive at a venue-adjusted line.
Blue Chip Analytics power ratings represent expected point margin against an average FBS opponent on a neutral field, calculated from game data sourced via CollegeFootballData.com (CFBD). They are one input: cross-reference with the travel, rest, and weather data above before drawing conclusions.
Ohio won and Ohio covered the spread.


