Baylor defeated SMU 48–45 in a nail-biter. Baylor covered by 5.5; Game went Over by 27.5.
Adjust any factor to update your projected line
Positive adjustment = favours home team
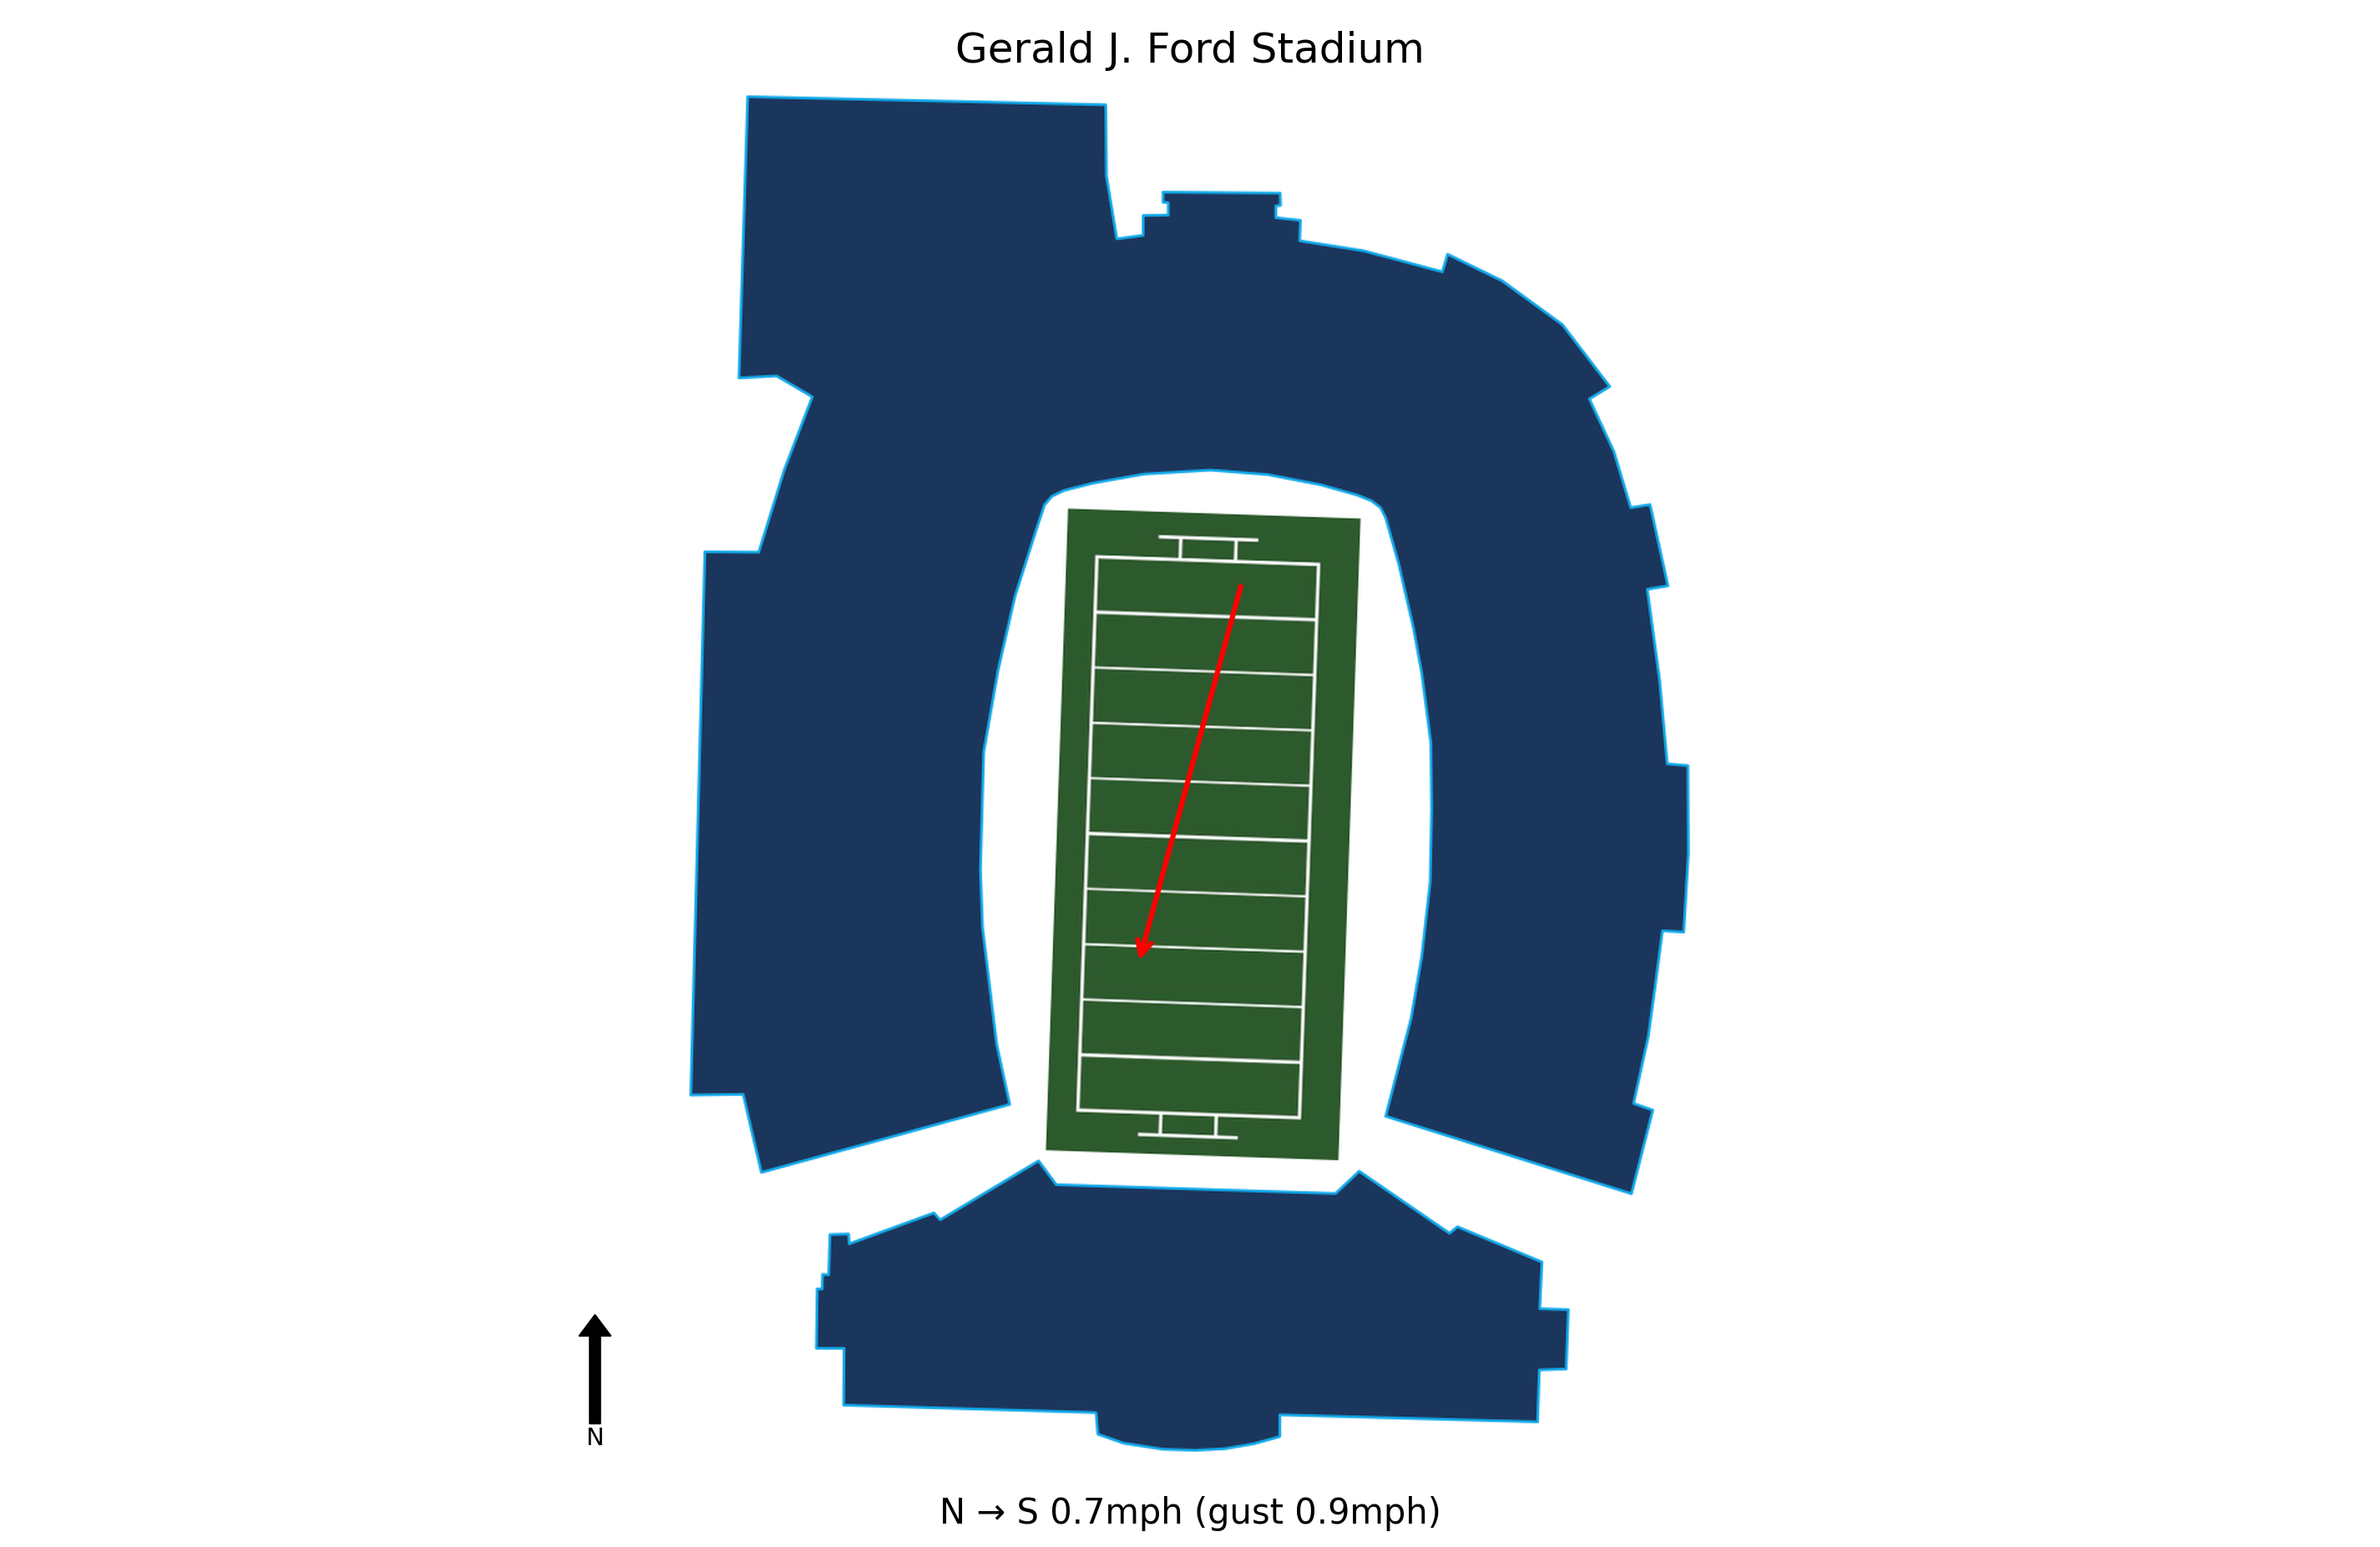
At kick-off, conditions at Gerald J. Ford Stadium were Partly cloudy, 79.0°F, Heat Index 80.6°F with winds of 0.7 mph. Weather is not expected to be a meaningful factor in this game. Historical weather data for this game is preserved in the panel below.

79.0°F
Baylor rallied from a 14-point deficit in the fourth quarter, scoring two touchdowns in the final 5:30 to force overtime, then won in double OT. This shows the team's mental toughness and ability to perform under pressure, which could carry over into future games.
Robertson threw for 440 yards and 4 touchdowns, marking his third consecutive 400-yard game. He joins elite company among Big 12 QBs and has shown no interceptions through two games, making him a reliable fantasy and betting asset.
Ashtyn Hawkins (10 catches, 145 yards), Josh Cameron (9 catches, 151 yards, TD), and Kobe Prentice (4 catches, 63 yards, 2 TDs) all contributed big plays. The depth and big-play ability of the receivers will be a key factor against weaker defenses.
Baylor allowed 45 points and gave up big plays (two 75-yard TDs), but the defense forced a missed field goal in regulation and held SMU without a first down in the second overtime. Consistency will be needed against stronger opponents.
Baylor hosts FCS Samford next week, a team that should be overmatched. This game provides an opportunity to build confidence, work on defensive issues, and potentially rest starters before conference play.
SMU led for 3.5 quarters and was up 38-24 with 8:38 left, but allowed Baylor to score 21 points in the final 5:30 of regulation and overtime, ultimately losing 48-45. This shows a critical inability to close out games against FBS opponents.
Kevin Jennings threw for 296 yards and 3 TDs, including two 75-yard scores, and TJ Harden ran for 115 yards and 3 TDs. However, a fumble in the fourth quarter led to a Baylor touchdown, shifting momentum. The offense must protect the ball better.
Kicker Collin Rogers missed a 57-yard field goal at the end of regulation and a 38-yard attempt in the second overtime, directly costing SMU the win. This inconsistency is a major concern for close games.
After holding Baylor to 24 points through 3.5 quarters, the defense allowed 24 points in the final 5:30 of regulation and overtime, including two touchdown passes in the last 34 seconds. The secondary was exposed against a 400-yard passer.
SMU has now lost three straight games against FBS opponents (Clemson, Penn State, Baylor) after a strong 2024 season. This pattern suggests they struggle against higher-level competition, which is critical for their next game against Missouri State (FBS transition team).
Baylor travels 90 miles to this game, a short road trip.
Baylor won by 3 in a nail-biter.
Baylor covered the spread.
The total went Over by 27.5 points.
Blue Chip Analytics power ratings favour SMU (9.9) over Baylor (9.3) by 0.6 points on a neutral field. After adding home field advantage, the rating-implied line may differ meaningfully from the market spread. SMU brings one of the stronger home environments in the FBS to this matchup (Blue Chip HFA: 3.2). Add this to the neutral-site differential to arrive at a venue-adjusted line.
Blue Chip Analytics power ratings represent expected point margin against an average FBS opponent on a neutral field, calculated from game data sourced via CollegeFootballData.com (CFBD). They are one input: cross-reference with the travel, rest, and weather data above before drawing conclusions.
Baylor won and Baylor covered the spread.


