California defeated SMU 38–35 in a nail-biter. California covered by 16.5; Game went Over by 19.5. Blue Chip Analytics had rated SMU 15.6 points stronger on a neutral field.
Adjust any factor to update your projected line
Positive adjustment = favours home team
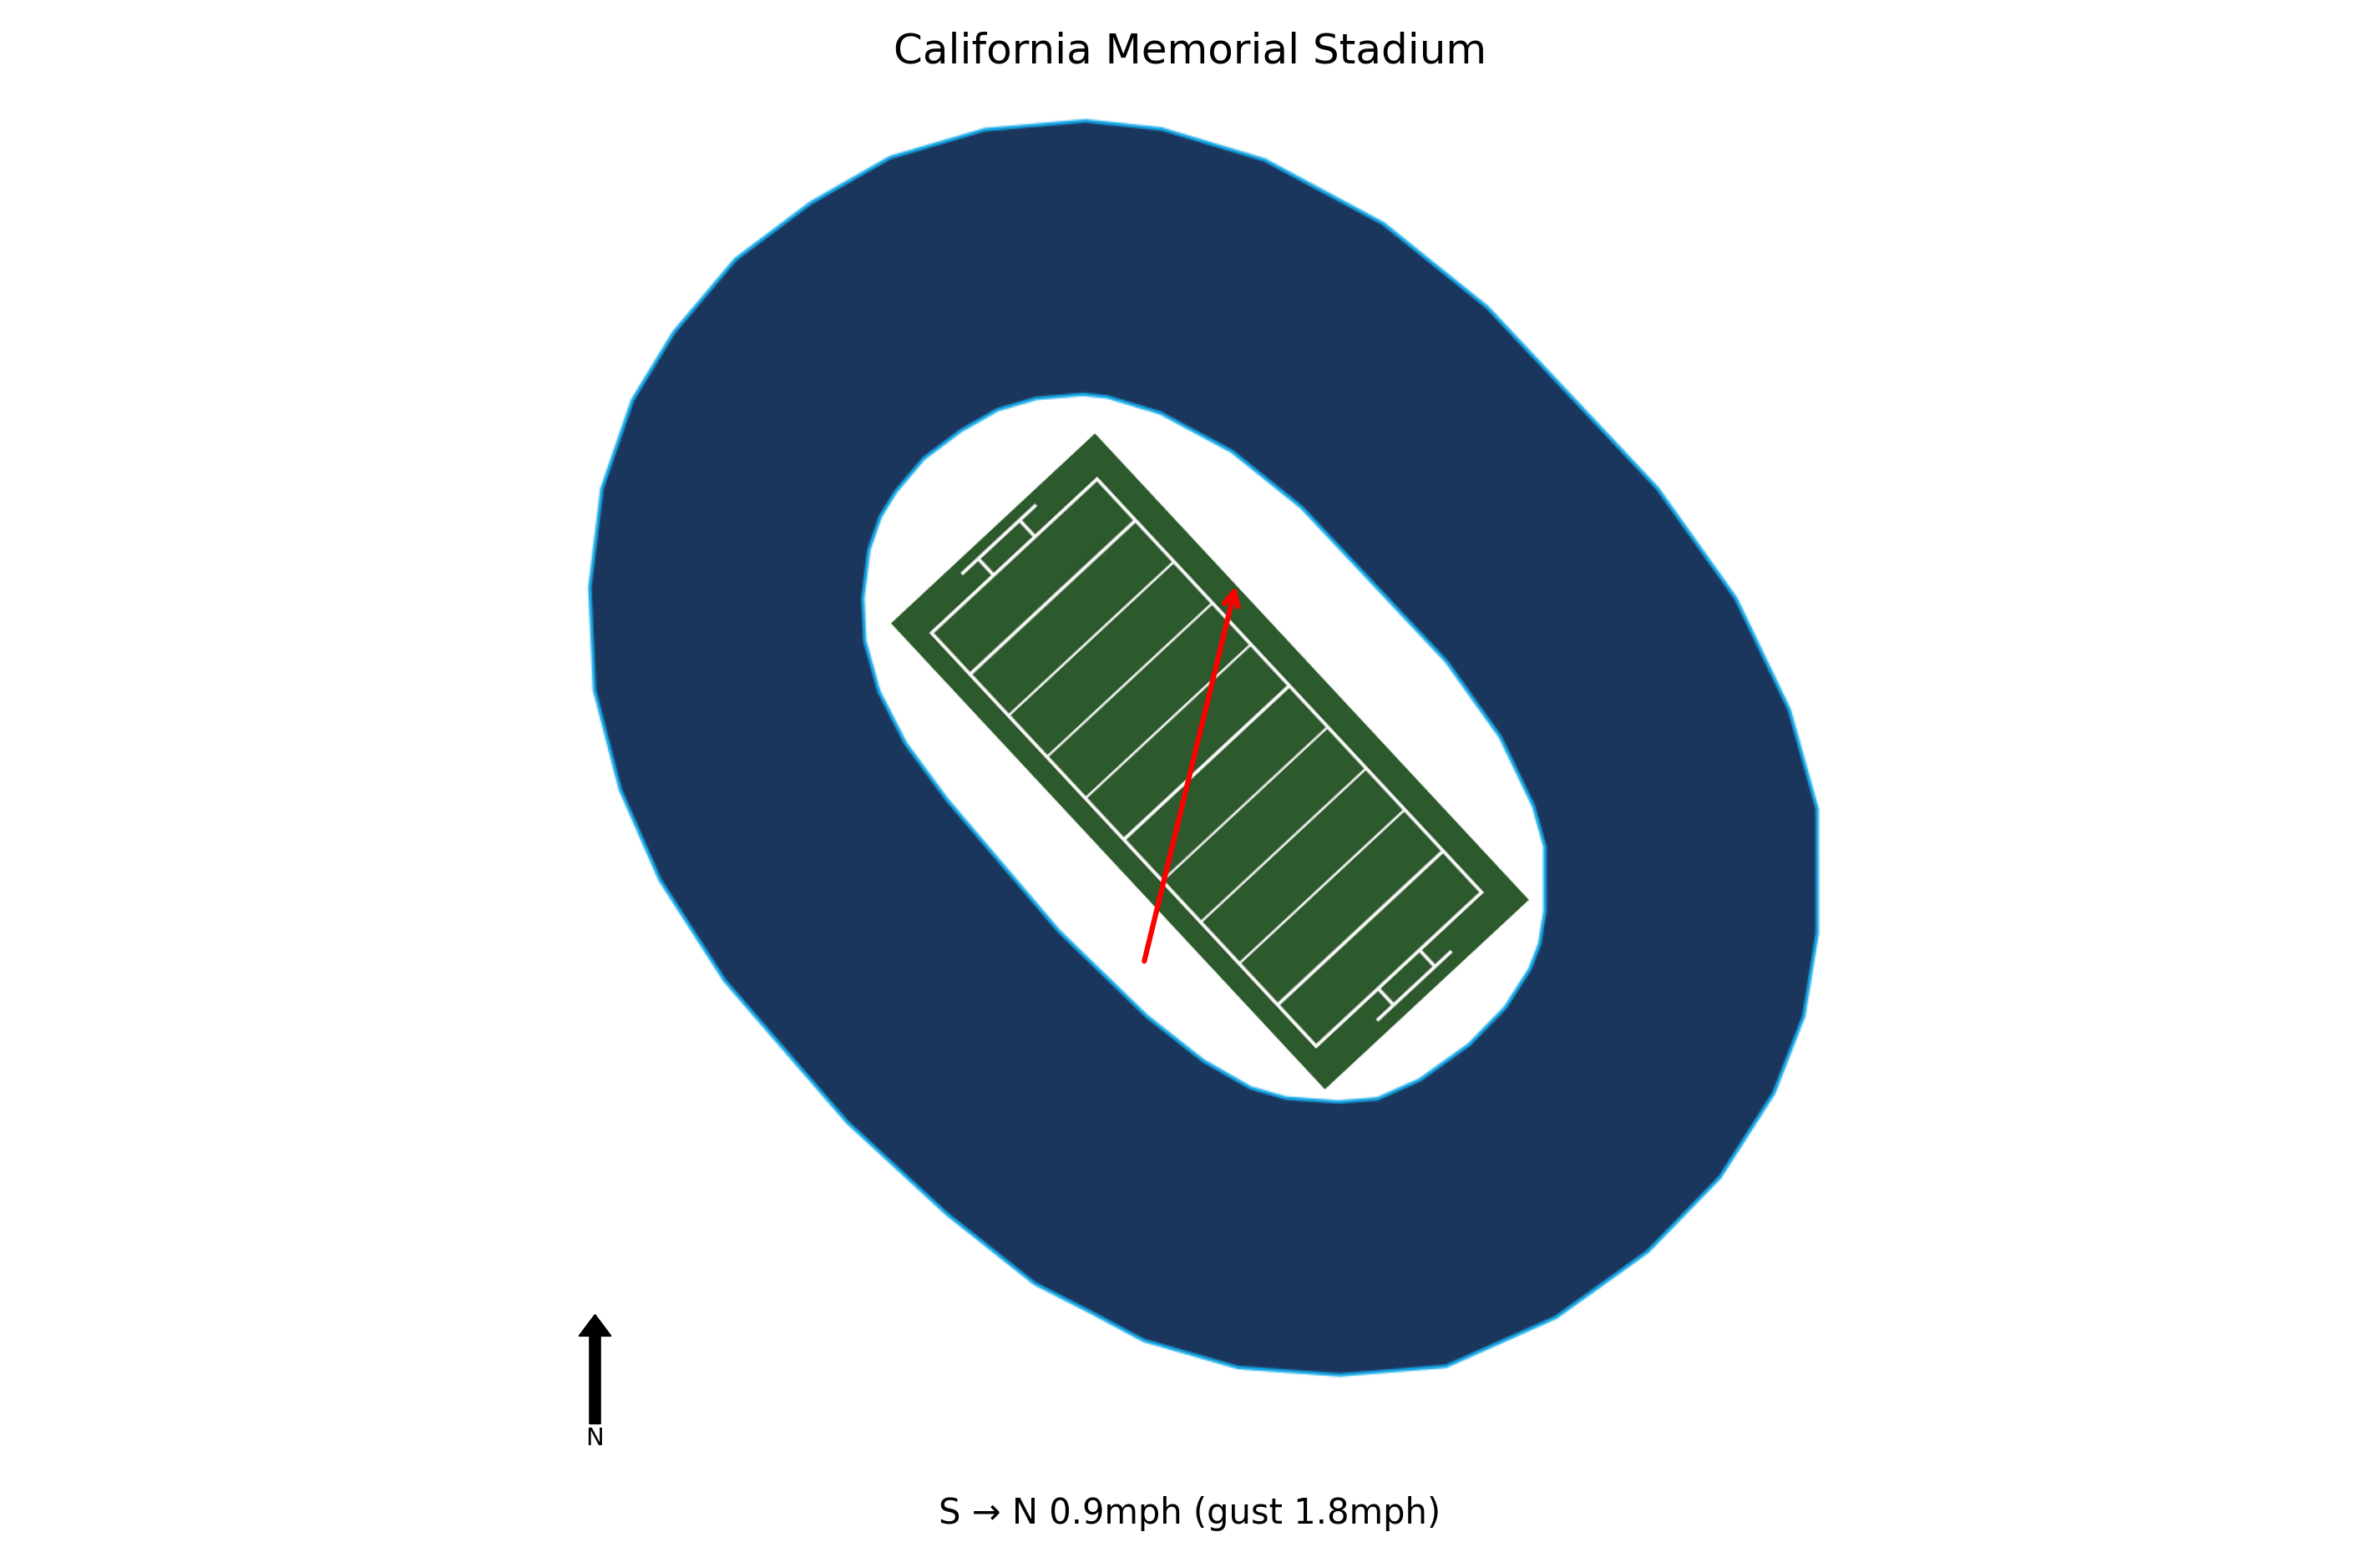
At kick-off, conditions at California Memorial Stadium were Clear, 50.7°F, Wind Chill 50.7°F with winds of 0.9 mph. Weather is not expected to be a meaningful factor in this game. Historical weather data for this game is preserved in the panel below.

50.7°F
SMU lost 38-35 to Cal, squandering a chance to clinch a berth in the ACC championship game for the second straight year. The loss drops them to 8-4 overall and 6-2 in conference play, ending their title hopes.
The Mustangs fell behind 24-7 after allowing 21 unanswered points in the second quarter. Cal scored 38 points, the second-most allowed by SMU this season, and gained 452 yards, the third-most by an opponent, highlighting defensive vulnerabilities.
SMU rallied to take a 35-31 lead with 2:22 remaining, but the defense couldn't hold, allowing a 75-yard touchdown drive. A missed 52-yard field goal with 8 seconds left sealed the loss, showing an inability to finish.
Quarterback Kevin Jennings threw for 250 yards, 2 touchdowns, and 1 interception. Running back Chris Johnson Jr. rushed for 128 yards and a touchdown on 10 carries, providing a strong ground game that wasn't enough to overcome the deficit.
SMU will await a bowl invitation after the loss. The team must address slow starts and defensive lapses to be competitive in their postseason matchup, as they've shown inconsistency on the road in conference play.
Cal scored 38 points against a strong SMU defense, with QB Jaron-Keawe Sagapolutele throwing for 330 yards and 4 TDs. The offense showed poise in a game-winning drive, suggesting they can perform under pressure in bowl preparation.
Freshman safety Aiden Manutai made a crucial interception and a pass breakup on SMU's final drive, highlighting a defense that can create turnovers and make stops in critical moments.
Kendrick Raphael rushed 33 times for 111 yards and the game-winning TD, providing a reliable ground attack that can control the clock and complement the passing game.
Playing under interim coach Nick Rolovich after Justin Wilcox's firing, the team stayed united and won for the seniors, indicating strong morale and adaptability that could carry into a bowl game.
SMU travels 1,475 miles to this game, a significant road trip.
SMU arrives with a 2-hour body clock disadvantage.
California won by 3 in a nail-biter.
California covered the spread comfortably.
The total went Over by 19.5 points.
Blue Chip Analytics power ratings favour SMU (14.3) over California (-1.3) by 15.6 points on a neutral field. Despite playing at home, California faces a power rating deficit. Check whether the market spread accounts for this gap. California brings a meaningful home field advantage to this matchup (Blue Chip HFA: 2.5). Add this to the neutral-site differential to arrive at a venue-adjusted line.
Blue Chip Analytics power ratings represent expected point margin against an average FBS opponent on a neutral field, calculated from game data sourced via CollegeFootballData.com (CFBD). They are one input: cross-reference with the travel, rest, and weather data above before drawing conclusions.
California won and California covered the spread.


