Minnesota defeated Michigan State 23–20 in a nail-biter. Michigan State covered by 1.5; Game went Under by 1.5.
Adjust any factor to update your projected line
Positive adjustment = favours home team
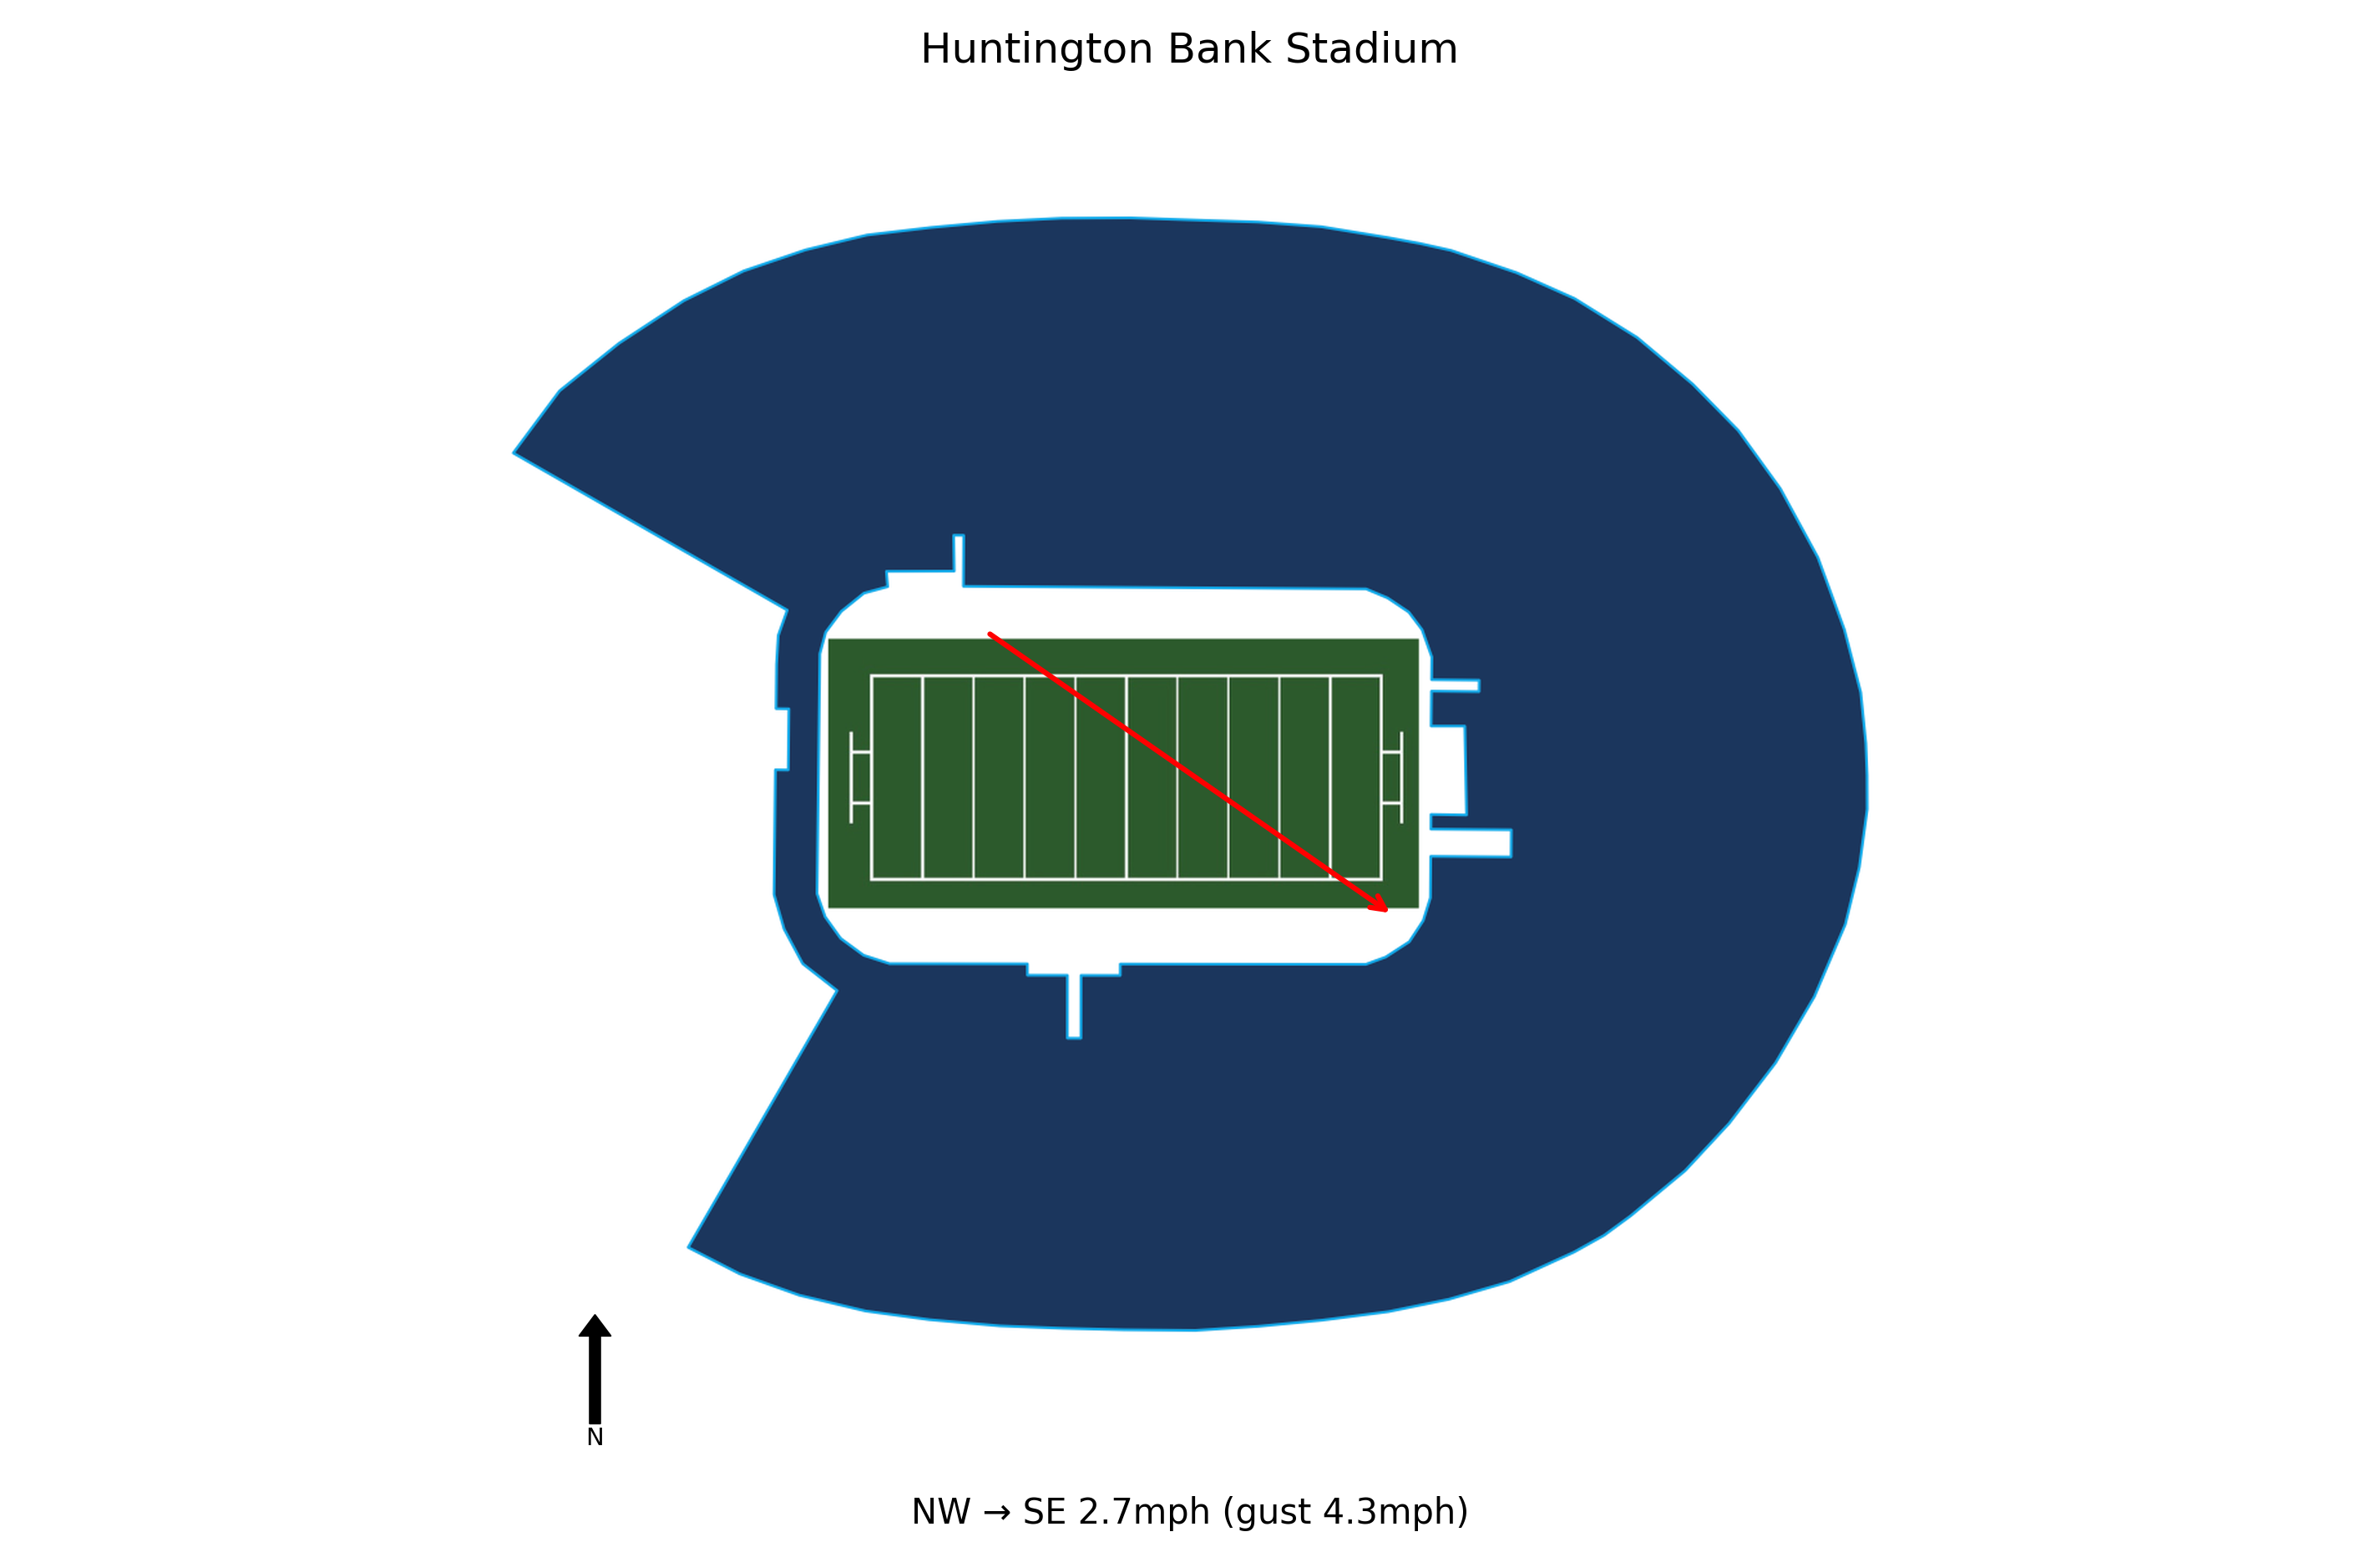
At kick-off, conditions at Huntington Bank Stadium were Partly cloudy, 41.0°F, Wind Chill 40.3°F with winds of 2.7 mph. Weather is not expected to be a meaningful factor in this game. Historical weather data for this game is preserved in the panel below.

41.0°F
Aidan Chiles was benched after 20 consecutive starts, and redshirt freshman Milivojevic provided a spark with 311 yards and a 71-yard touchdown pass, leading to a season-high 467 total yards.
Michigan State committed 10 penalties for 96 yards, including a crucial pass interference in overtime, and kicker Martin Connington missed field goals from 46 and 23 yards in regulation, contributing to the loss.
Elijah Tau-Tolliver rushed for 127 yards on 11 carries, and the team had a 85-yard run that set up a go-ahead touchdown late in the fourth quarter, showing offensive balance.
The defense allowed Minnesota to drive for a tying touchdown in the final 29 seconds of regulation, aided by a facemask penalty and pass interference, and gave up the game-winning score in overtime.
The Spartans are now 0-6 in Big Ten play for the first time since 2016, and face a tough matchup next week against Penn State, needing to clean up penalties and special teams to compete.
Michigan State travels 463 miles to this game, a moderate road trip.
Michigan State arrives with a 1-hour body clock shift.
Minnesota won by 3 in a nail-biter.
Michigan State covered the spread narrowly.
The total went Under by 1.5 points.
Blue Chip Analytics power ratings favour Minnesota (5.5) over Michigan State (4.1) by 1.4 points on a neutral field. After adding home field advantage, the rating-implied line may differ meaningfully from the market spread. Minnesota brings a meaningful home field advantage to this matchup (Blue Chip HFA: 2.7). Add this to the neutral-site differential to arrive at a venue-adjusted line.
Blue Chip Analytics power ratings represent expected point margin against an average FBS opponent on a neutral field, calculated from game data sourced via CollegeFootballData.com (CFBD). They are one input: cross-reference with the travel, rest, and weather data above before drawing conclusions.
Minnesota won and Michigan State covered the spread.


