Air Force defeated Bucknell 49–13 in a dominant performance. Air Force covered by 5.5; Game went Over by 8.5.
Adjust any factor to update your projected line
Positive adjustment = favours home team
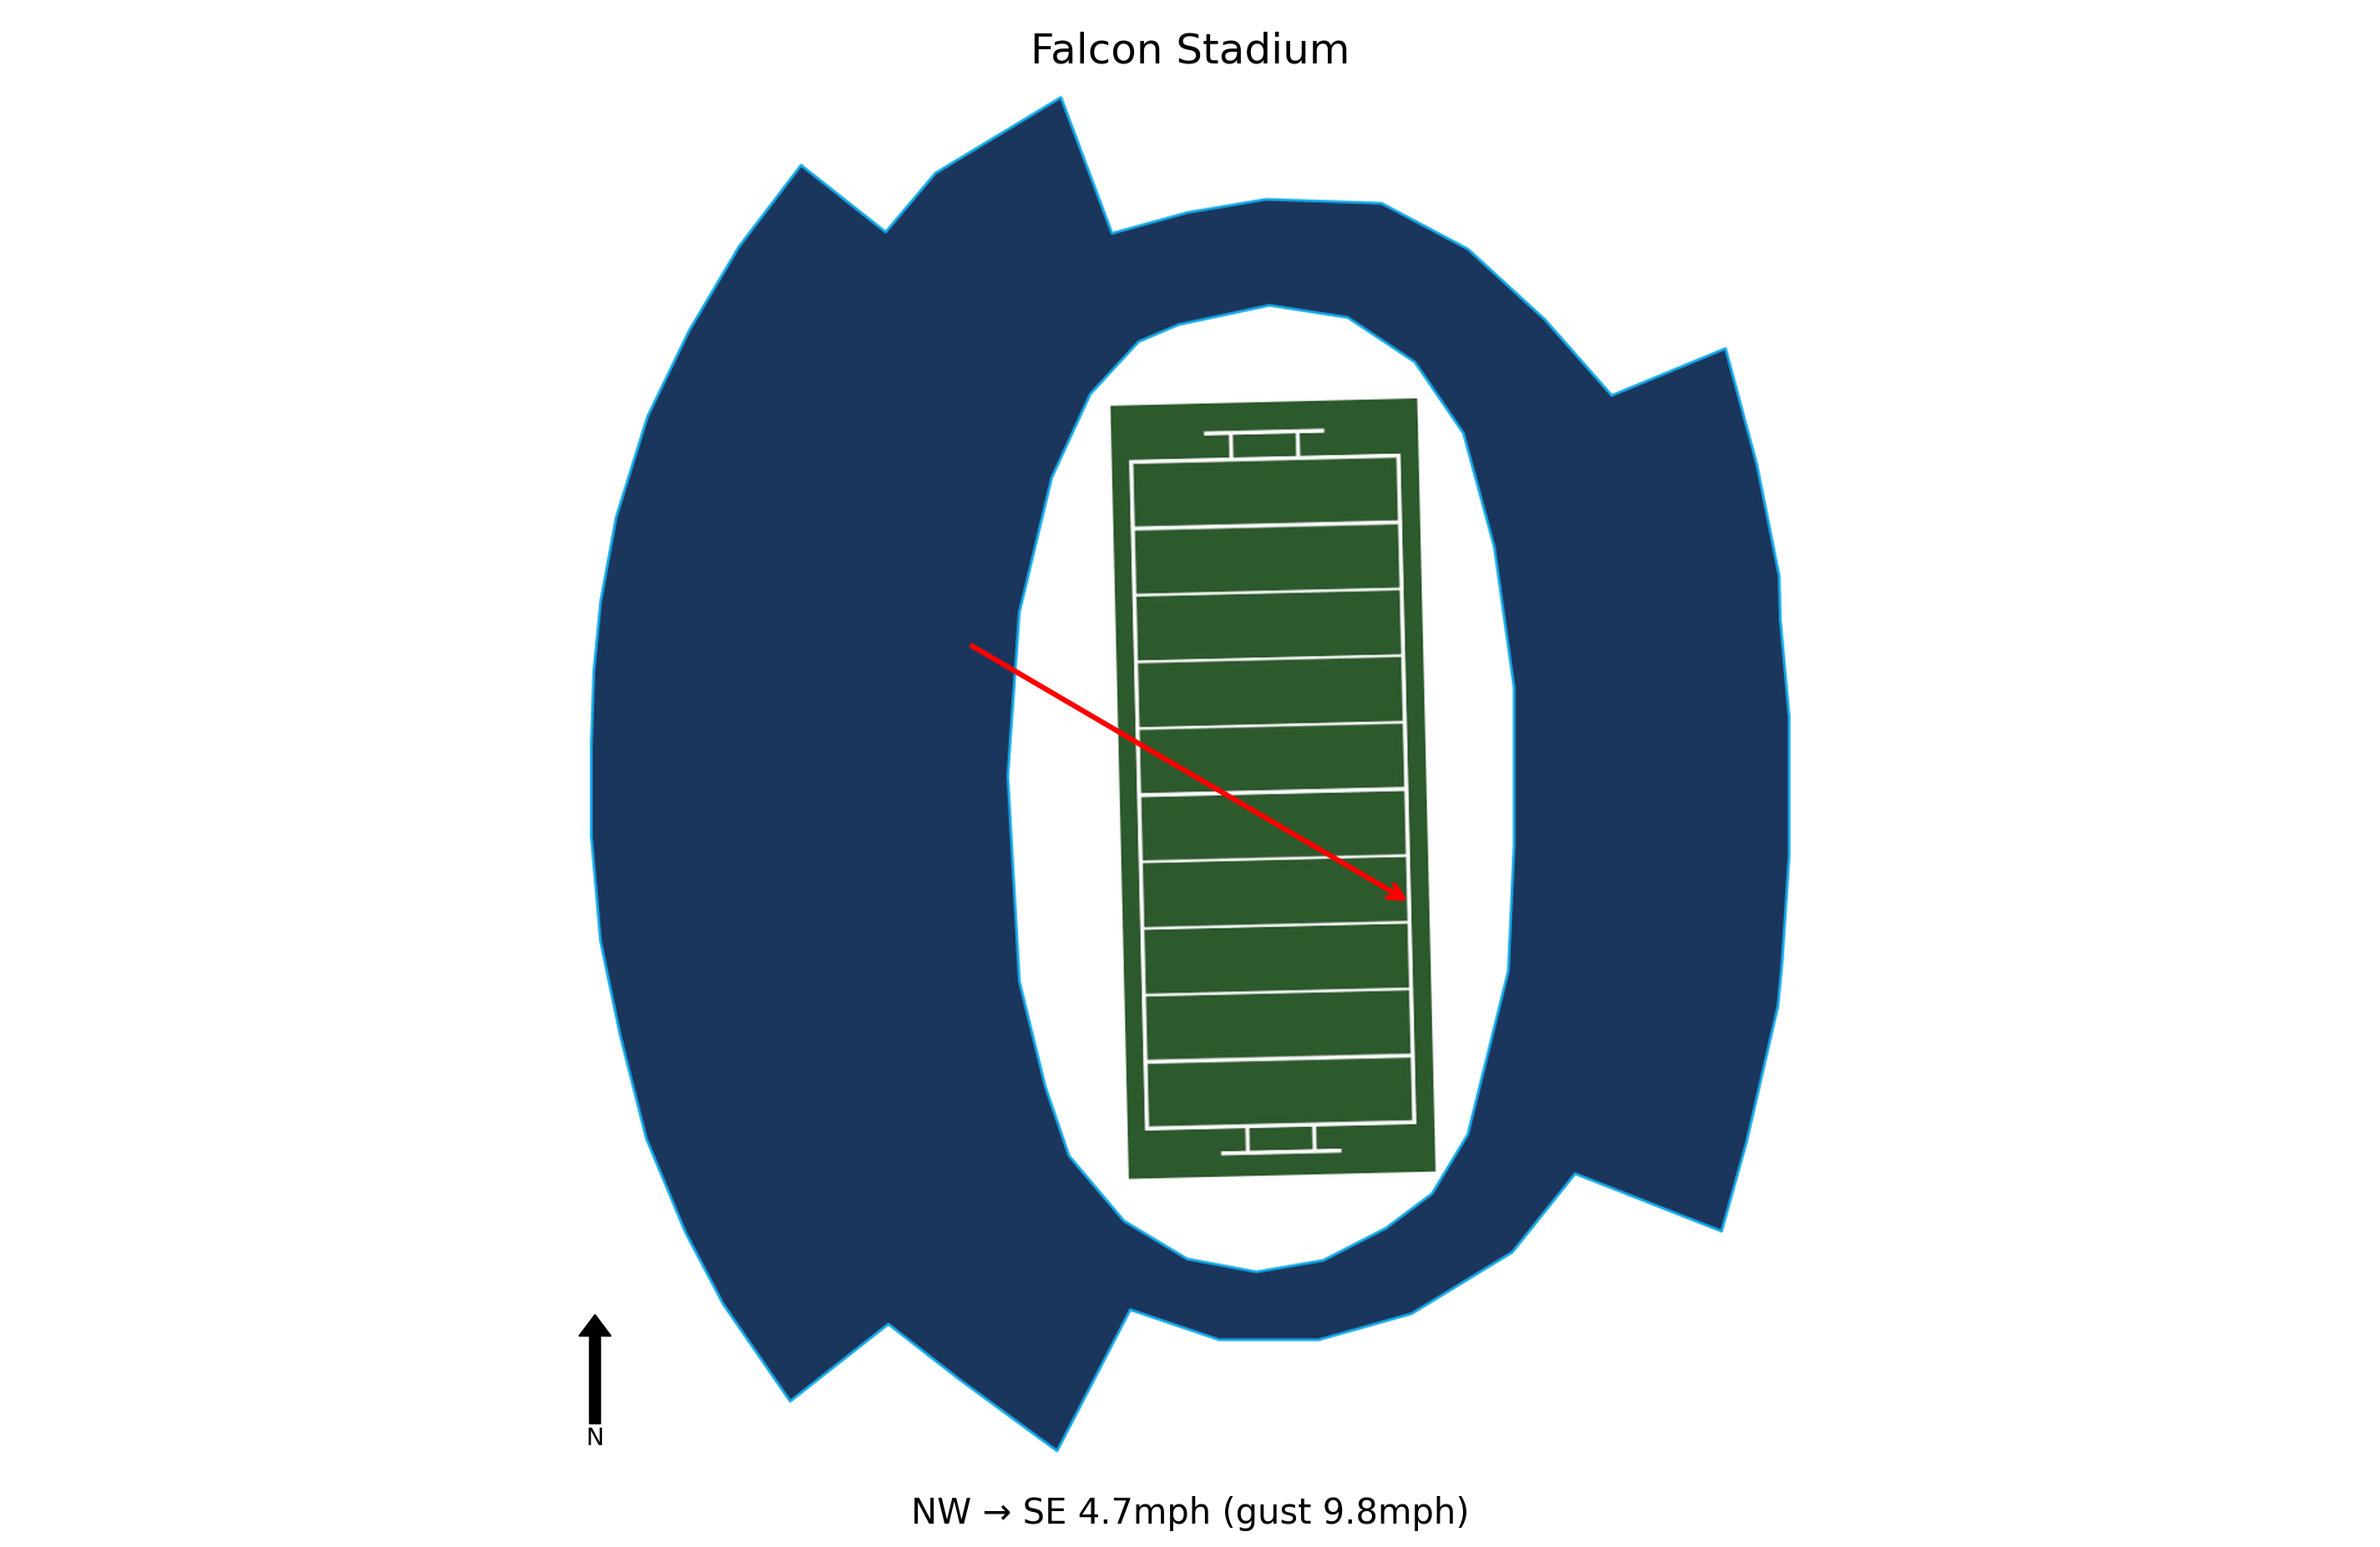
At kick-off, conditions at Falcon Stadium were Thundery outbreaks possible, 64.6°F, Feels Like 64.6°F with winds of 4.7 mph. Weather is not expected to be a meaningful factor in this game. Historical weather data for this game is preserved in the panel below.

64.6°F
Air Force won 49-13, extending their nation-leading 19th straight season-opening victory and fifth straight win overall, showcasing strong offensive and defensive performances.
Johnson threw for 112 yards and 2 touchdowns, a significant improvement from last season where he had only 1 TD pass in 6 games, indicating potential for a more dynamic passing attack.
Harris scored 3 touchdowns (2 rushing, 1 receiving) with 66 rushing yards and 83 receiving yards, highlighting his versatility and importance to the offense.
Korey Johnson returned a fumble 34 yards for a touchdown, and the defense held Bucknell to 13 points, showing ability to create turnovers and limit scoring.
After an initial punt, Air Force scored four consecutive touchdowns before a missed field goal, demonstrating offensive efficiency and ability to sustain drives.
Bucknell travels 1,484 miles to this game, a significant road trip.
Bucknell arrives with a 2-hour body clock disadvantage.
Air Force won by 36 in a dominant performance.
Air Force covered the spread.
The total went Over by 8.5 points.
Blue Chip Analytics power ratings favour Air Force (-8.8) over Bucknell (-28.0) by 19.2 points on a neutral field. After adding home field advantage, the rating-implied line may differ meaningfully from the market spread. Air Force brings a meaningful home field advantage to this matchup (Blue Chip HFA: 2.6). Add this to the neutral-site differential to arrive at a venue-adjusted line.
Blue Chip Analytics power ratings represent expected point margin against an average FBS opponent on a neutral field, calculated from game data sourced via CollegeFootballData.com (CFBD). They are one input: cross-reference with the travel, rest, and weather data above before drawing conclusions.
Air Force won and Air Force covered the spread.


