App State defeated Charlotte 34–11 to secure a comfortable win. App State covered by 14.5; Game went Under by 8.5.
Adjust any factor to update your projected line
Positive adjustment = favours home team
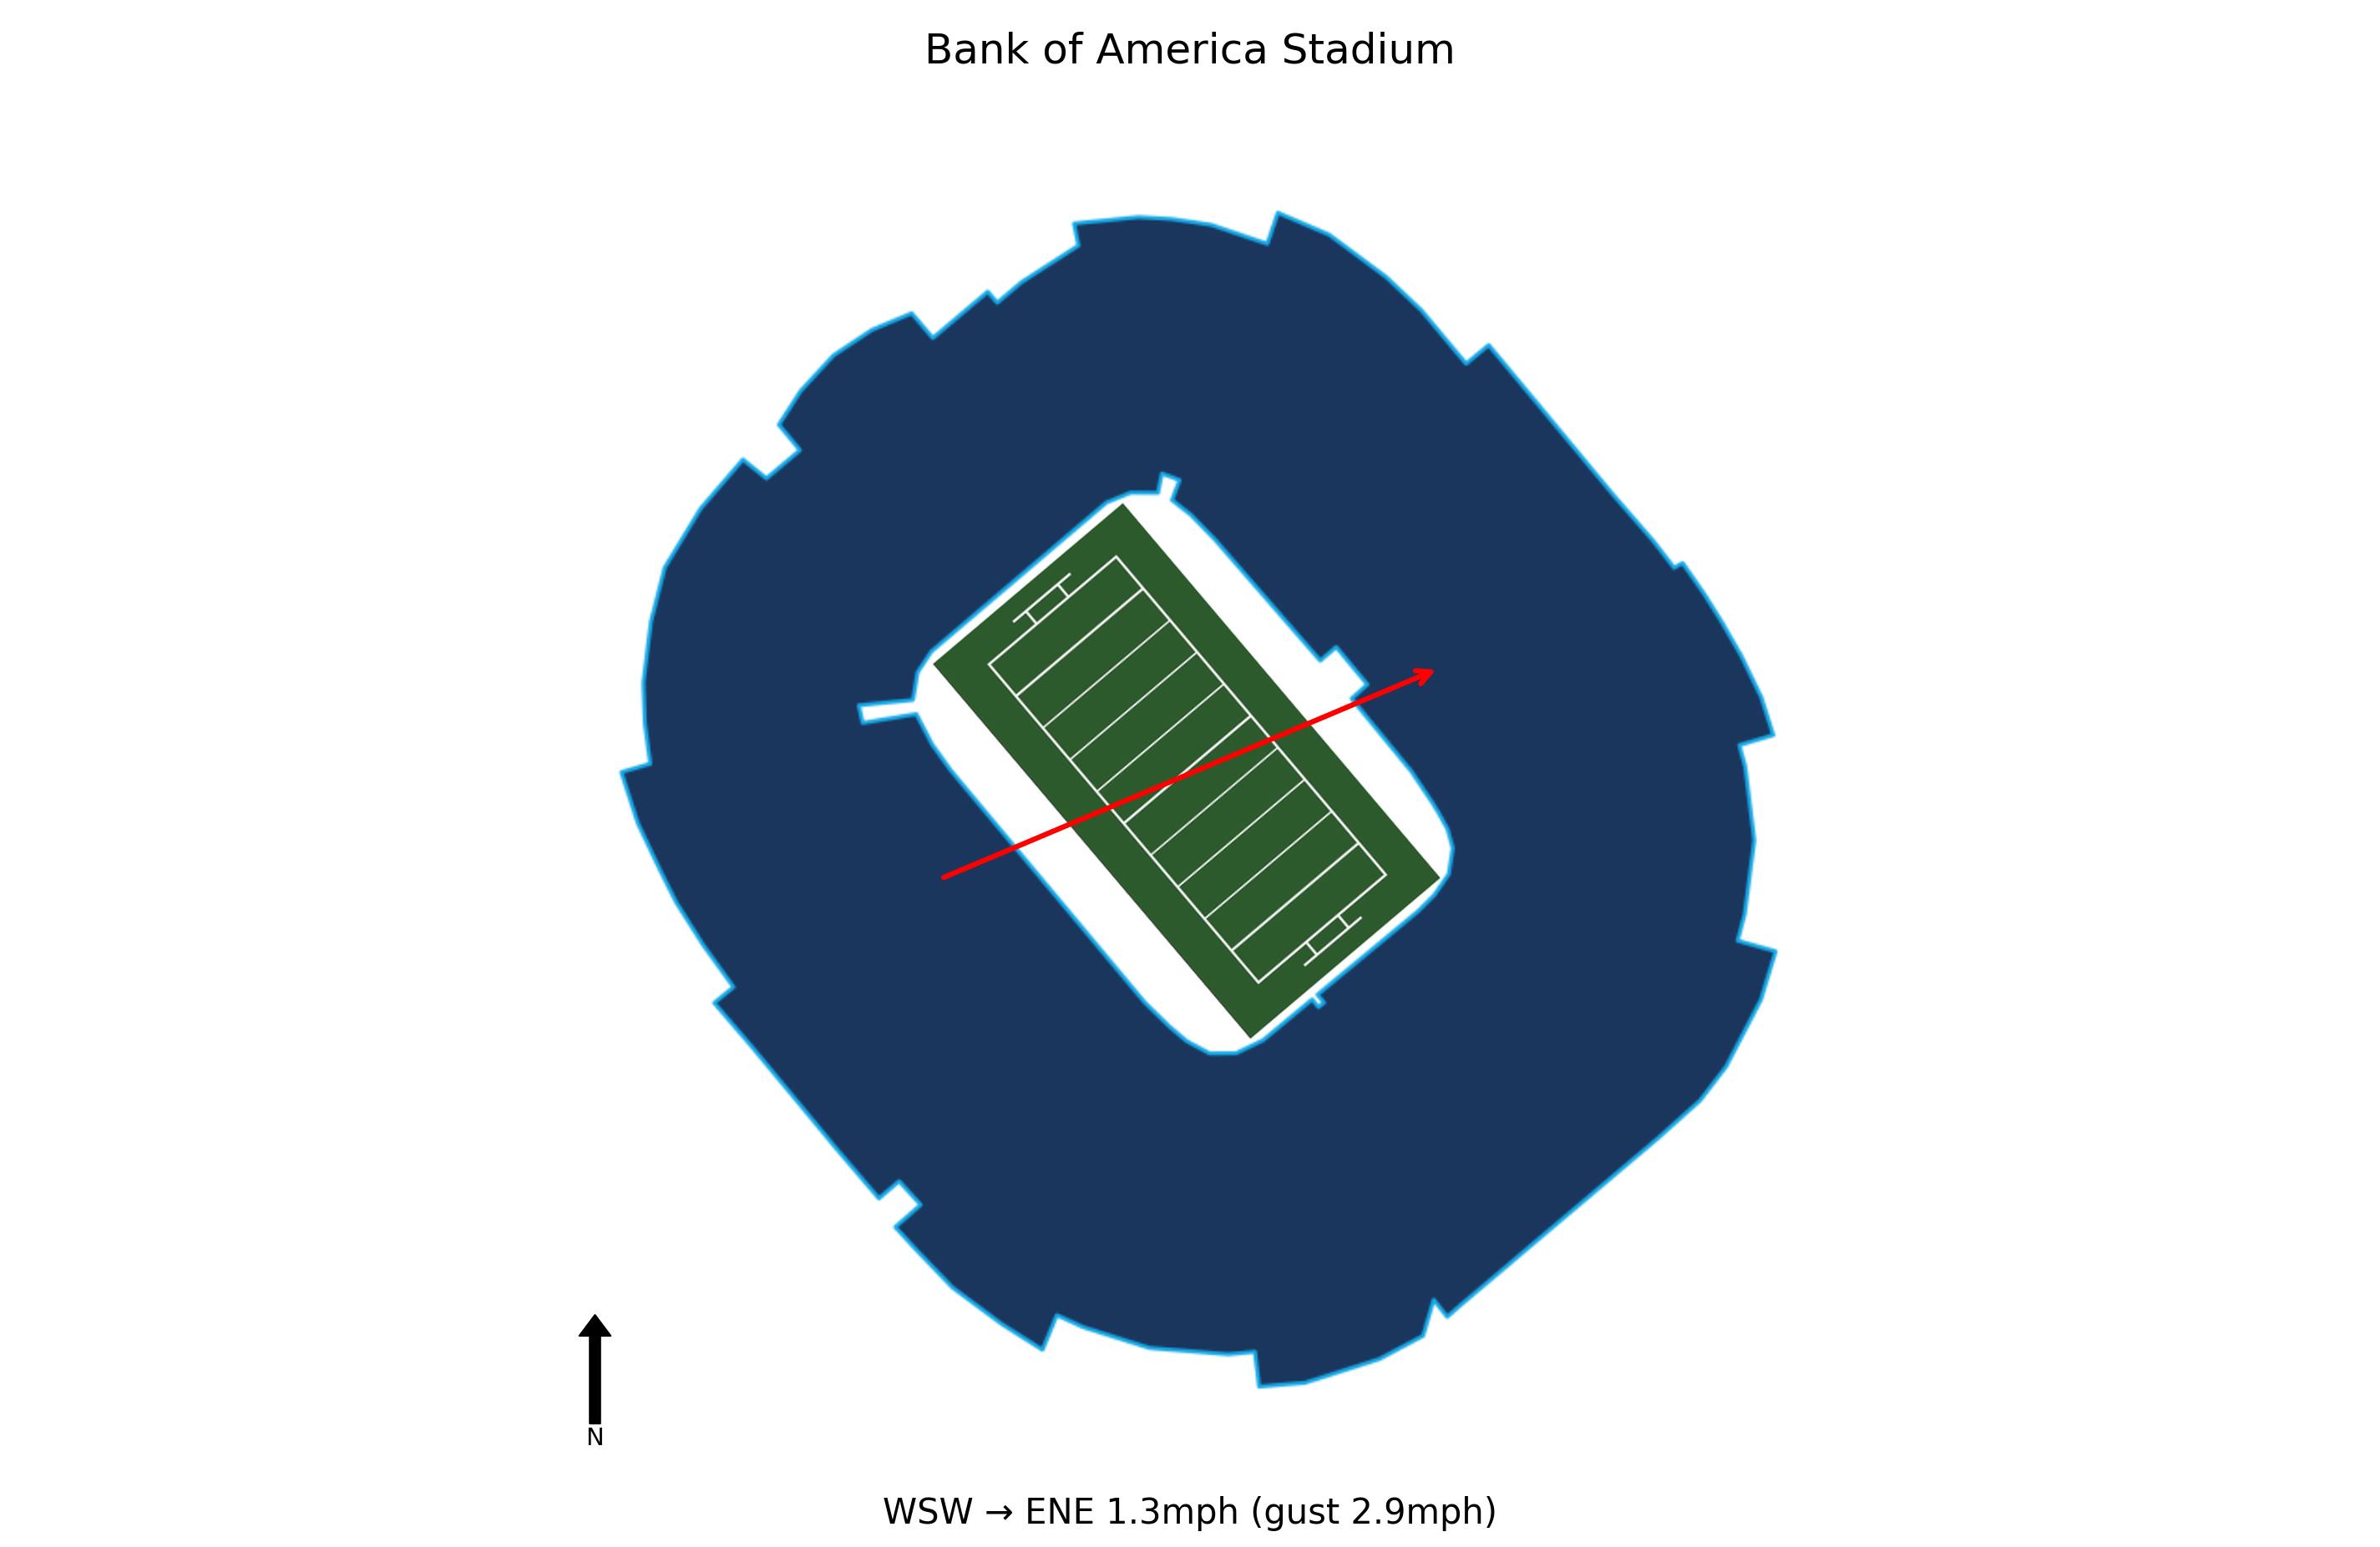
At kick-off, conditions at Bank of America Stadium were Clear, 76.1°F, Feels Like 78.8°F with winds of 1.3 mph. Weather is not expected to be a meaningful factor in this game. Historical weather data for this game is preserved in the panel below.

76.1°F
App State amassed 586 total yards, with QB AJ Swann throwing for 368 yards and 3 TDs, and RB Rashod Dubinion rushing for 111 yards and a TD. This high-powered offense suggests they can exploit weaker defenses.
The Mountaineers held Charlotte to just 218 total yards and 11 points, forcing a field goal-heavy scoring. This defensive dominance indicates they can control games against less potent offenses.
In Dowell Loggains' first game as head coach, the team responded with a 27-0 run after an early deficit. This resilience and buy-in bode well for future games, especially against similar competition.
WR Jaden Barnes had 134 receiving yards and a TD on 6 catches, showing a deep threat capability. Swann's 31 completions on 46 attempts indicate a reliable passing game that can stretch the field.
The Mountaineers scored TDs on drives of 81 and 19 yards, plus field goals from long range. Their ability to finish drives with points (27 unanswered) suggests they can capitalize on scoring opportunities.
App State travels 83 miles to this game, a short road trip.
App State won by 23 to secure a comfortable win.
App State covered the spread comfortably.
The total went Under by 8.5 points.
Blue Chip Analytics power ratings favour App State (-10.8) over Charlotte (-23.1) by 12.3 points on a neutral field. Despite playing at home, Charlotte faces a power rating deficit. Check whether the market spread accounts for this gap. Charlotte brings a neutral home environment to this matchup (Blue Chip HFA: 0.0). Add this to the neutral-site differential to arrive at a venue-adjusted line.
Blue Chip Analytics power ratings represent expected point margin against an average FBS opponent on a neutral field, calculated from game data sourced via CollegeFootballData.com (CFBD). They are one input: cross-reference with the travel, rest, and weather data above before drawing conclusions.
App State won and App State covered the spread.


