Virginia Tech defeated California 42–34 in a one-score game. Virginia Tech covered by 2.0; Game went Over by 25.5.
Adjust any factor to update your projected line
Positive adjustment = favours home team
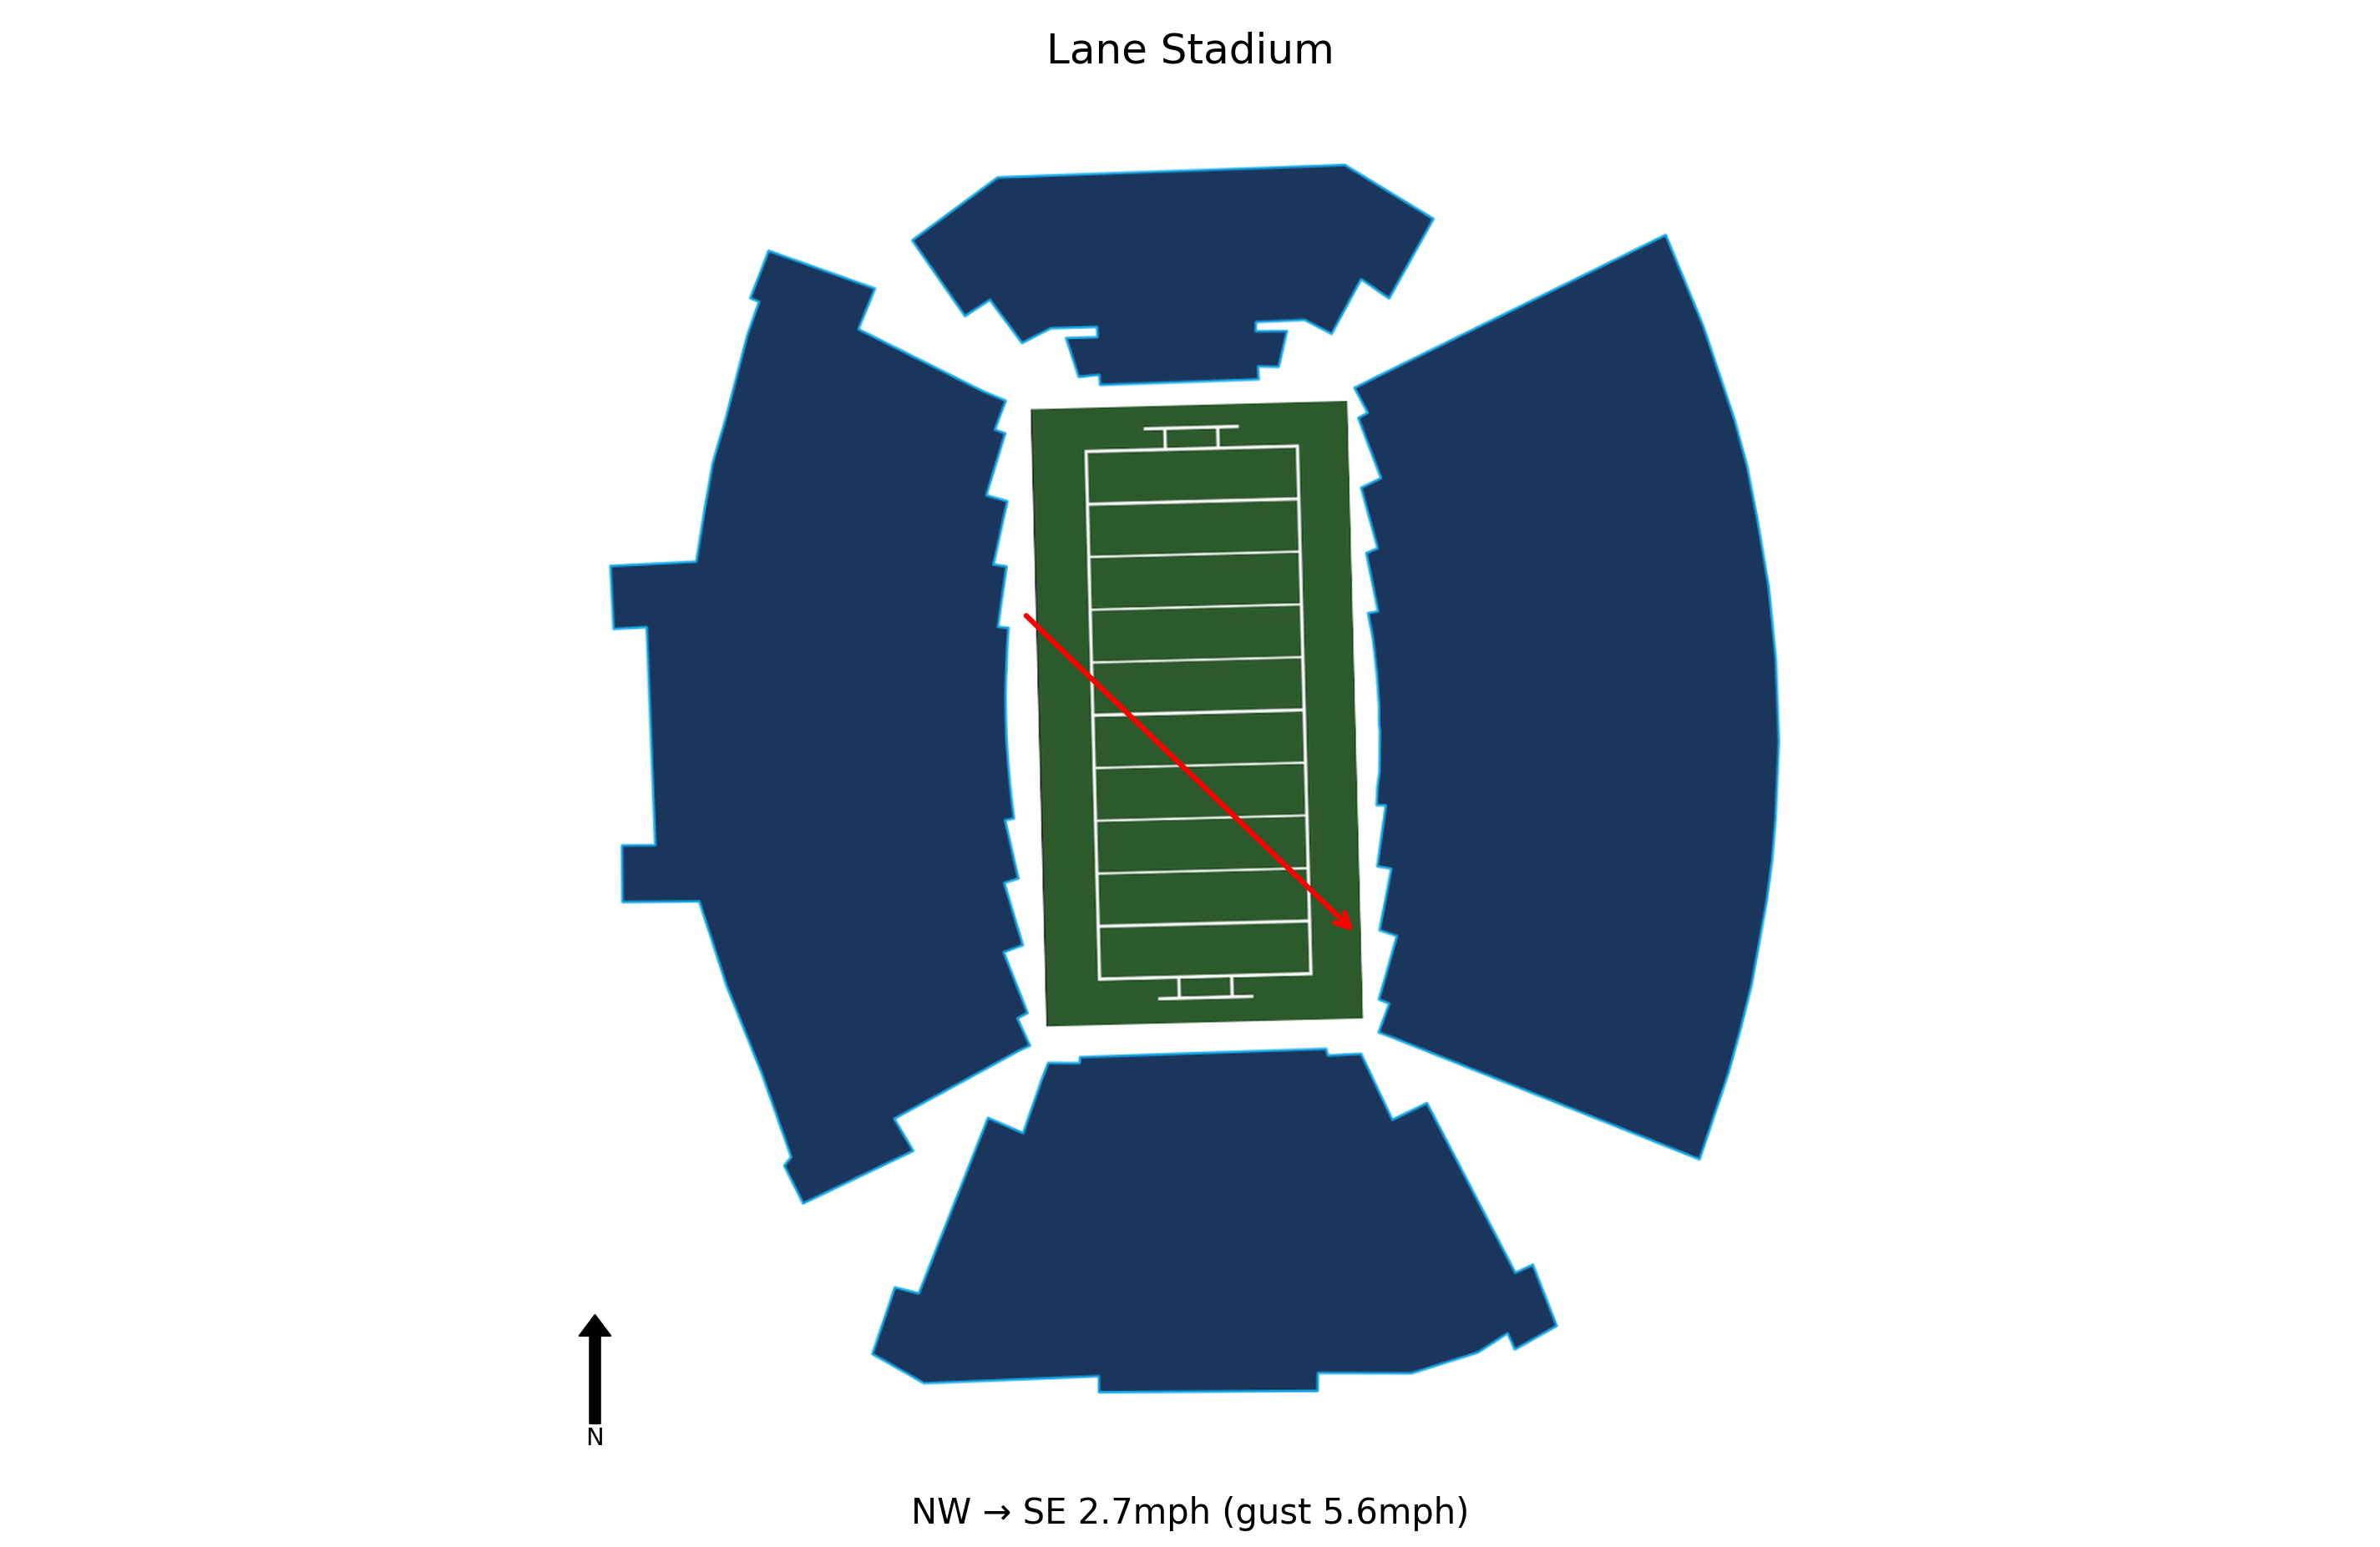
At kick-off, conditions at Lane Stadium were Clear, 41.0°F, Wind Chill 39.0°F with winds of 2.7 mph. Weather is not expected to be a meaningful factor in this game. Historical weather data for this game is preserved in the panel below.

41.0°F
Virginia Tech has shown improved spirit and competitiveness since the coaching change, moving to 3-2 under interim coach Philip Montgomery. This resilience was key in overcoming a 10-point halftime deficit and winning in double overtime.
Quarterback Kyron Drones was the offensive engine, rushing 21 times for 137 yards and two touchdowns, while also passing for 119 yards and three touchdowns. His ability to make plays with both his arm and legs will be crucial against Louisville's defense.
The Hokies amassed 357 rushing yards, led by Marcellous Hawkins' 167 yards on 21 carries. This ground dominance, combined with Drones' mobility, creates a formidable rushing attack that can control the clock and wear down defenses.
Defensive end Kemari Copeland recorded three sacks, and the defense forced four straight incompletions in the second overtime to seal the win. Generating consistent pressure will be vital against Louisville's offense.
Virginia Tech hosts a ranked Louisville team next Saturday. The Hokies will need to replicate their balanced offensive attack and defensive resilience to compete against a strong opponent.
California travels 2,278 miles to this game, a cross-country trip.
California arrives with a 3-hour body clock disadvantage.
Virginia Tech won by 8 in a one-score game.
Virginia Tech covered the spread narrowly.
The total went Over by 25.5 points.
Blue Chip Analytics power ratings favour Virginia Tech (1.1) over California (-3.6) by 4.7 points on a neutral field. After adding home field advantage, the rating-implied line may differ meaningfully from the market spread. Virginia Tech brings a meaningful home field advantage to this matchup (Blue Chip HFA: 2.6). Add this to the neutral-site differential to arrive at a venue-adjusted line.
Blue Chip Analytics power ratings represent expected point margin against an average FBS opponent on a neutral field, calculated from game data sourced via CollegeFootballData.com (CFBD). They are one input: cross-reference with the travel, rest, and weather data above before drawing conclusions.
Virginia Tech won and Virginia Tech covered the spread.


