NC State defeated Virginia 35–31 in a closely contested finish. NC State covered by 1.5; Game went Over by 13.5. Blue Chip Analytics had rated Virginia 6.7 points stronger on a neutral field.
Adjust any factor to update your projected line
Positive adjustment = favours home team
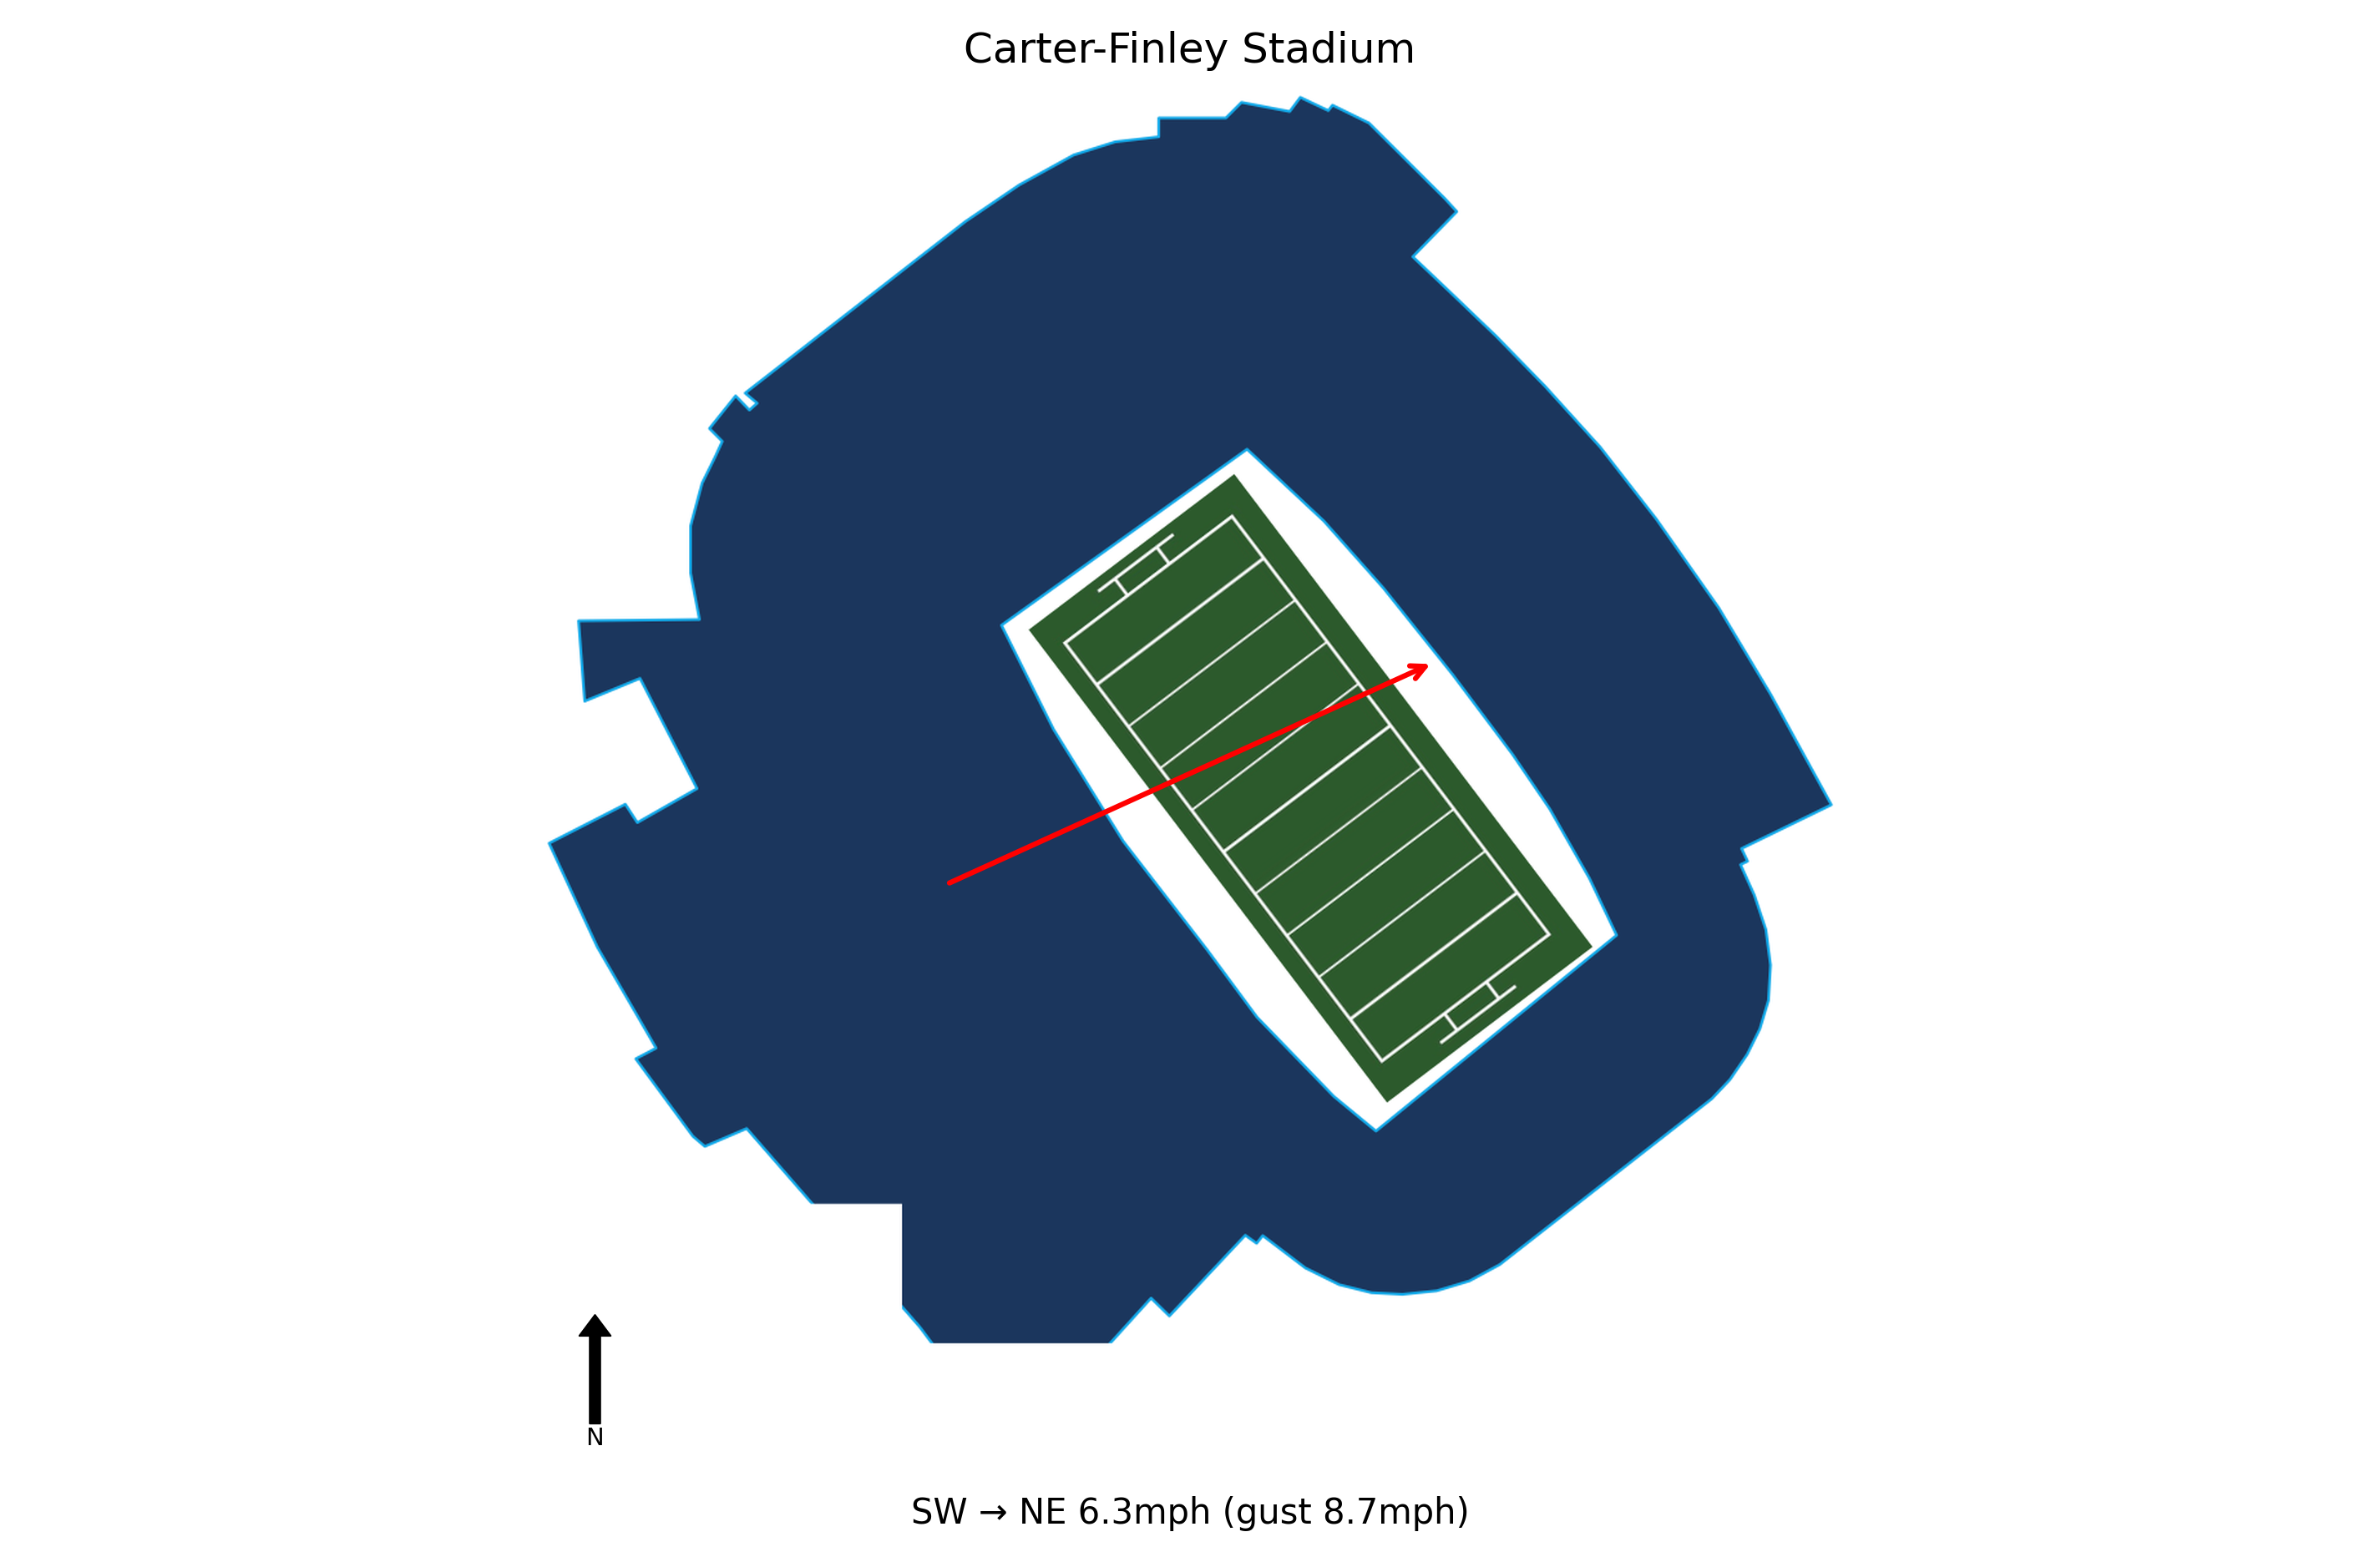
At kick-off, conditions at Carter-Finley Stadium were Cloudy, 92.1°F, Heat Index 98.2°F with winds of 6.3 mph. Weather is not expected to be a meaningful factor in this game. Historical weather data for this game is preserved in the panel below.

92.1°F
NC State trailed by 10 points but outscored Virginia 21-7 in the third quarter, with two rushing touchdowns from Hollywood Smothers and one from CJ Bailey, showing the offense's ability to rally and dominate after halftime.
The Wolfpack held Virginia scoreless in the fourth quarter, made a crucial stop on fourth-and-1 at the 8-yard line with 6:39 left, and sealed the win with an interception in the end zone, highlighting a resilient defense in clutch moments.
Hollywood Smothers rushed for 136 yards and two touchdowns, while CJ Bailey added 44 rushing yards and two scores, giving NC State a powerful ground game that controlled the second half and drained the clock.
CJ Bailey completed 16-of-22 passes for 200 yards and a touchdown, with no interceptions, providing steady passing to complement the run game and keep drives alive.
NC State travels to face rival Wake Forest on Thursday, giving them a quick turnaround to prepare for a conference opponent, which could test their depth and recovery.
Virginia travels 154 miles to this game, a short road trip.
NC State won by 4 in a closely contested finish.
NC State covered the spread narrowly.
The total went Over by 13.5 points.
Blue Chip Analytics power ratings favour Virginia (9.5) over NC State (2.8) by 6.7 points on a neutral field. Despite playing at home, NC State faces a power rating deficit. Check whether the market spread accounts for this gap. NC State brings a meaningful home field advantage to this matchup (Blue Chip HFA: 2.8). Add this to the neutral-site differential to arrive at a venue-adjusted line.
Blue Chip Analytics power ratings represent expected point margin against an average FBS opponent on a neutral field, calculated from game data sourced via CollegeFootballData.com (CFBD). They are one input: cross-reference with the travel, rest, and weather data above before drawing conclusions.
NC State won and NC State covered the spread.


