Tennessee defeated East Tennessee State 72–17 in a dominant performance. Tennessee covered by 14.5; Game went Over by 30.5.
Adjust any factor to update your projected line
Positive adjustment = favours home team
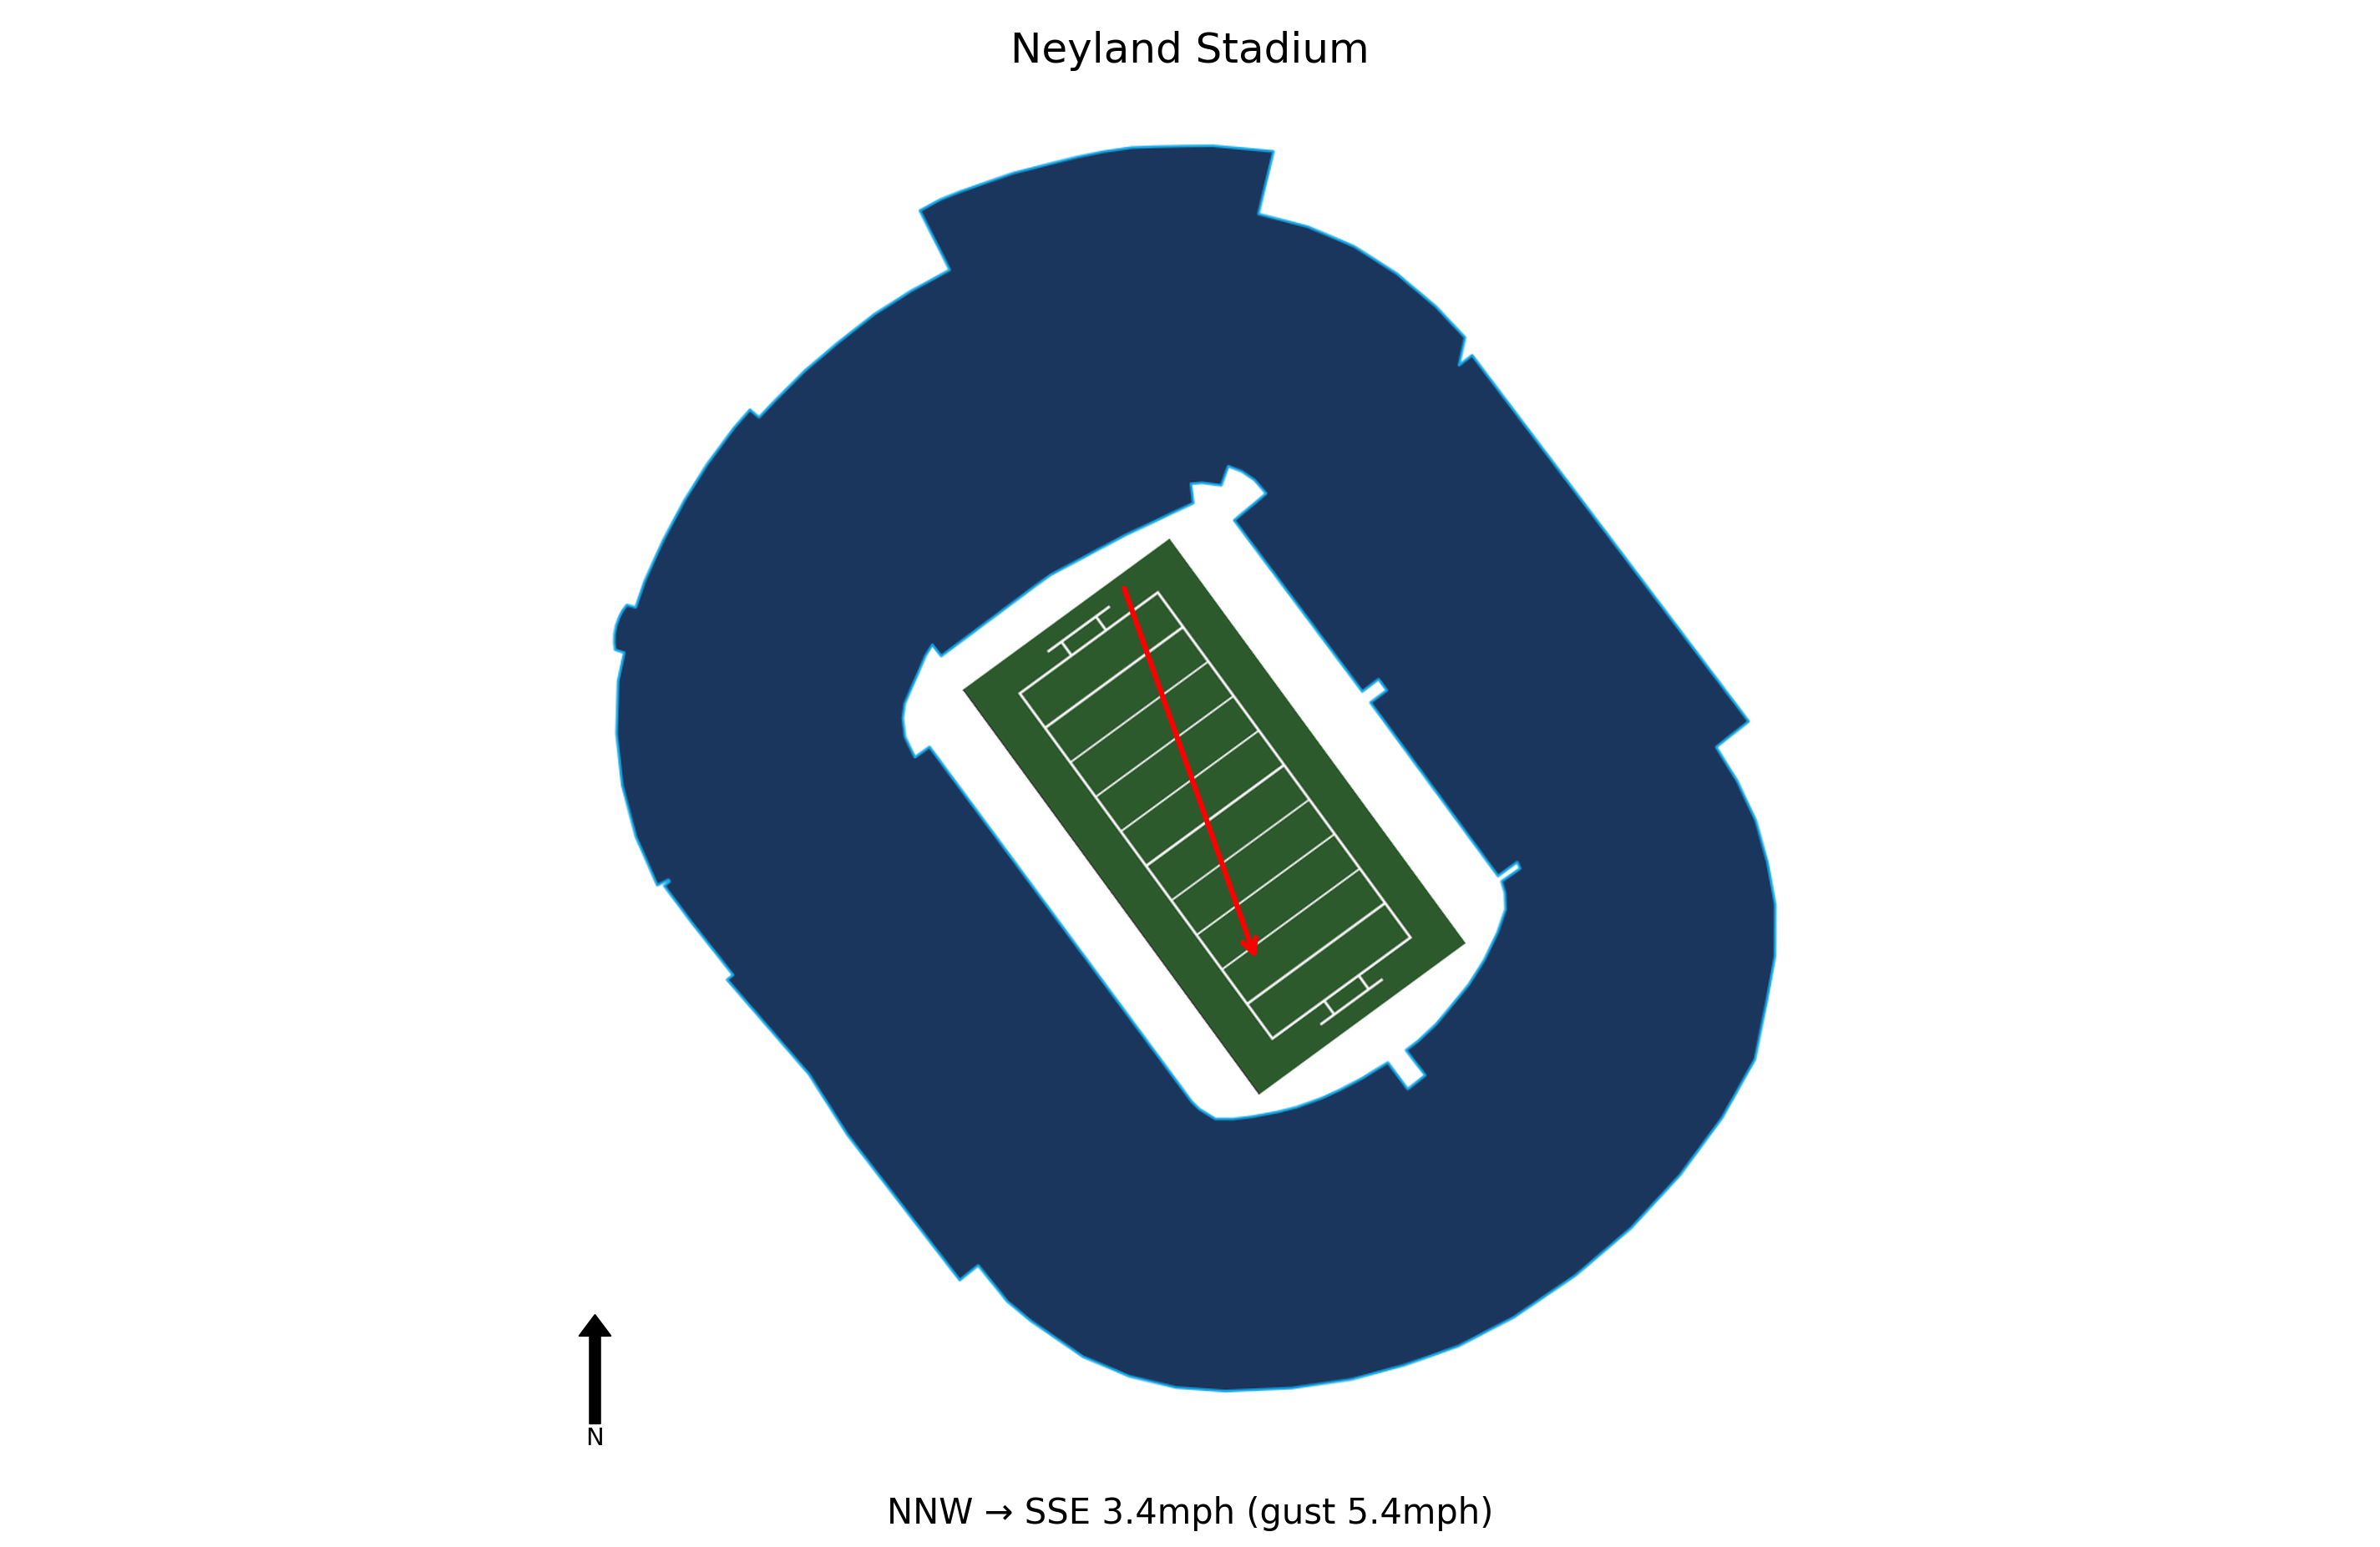
At kick-off, conditions at Neyland Stadium were Thundery outbreaks possible, 67.3°F, Feels Like 67.3°F with winds of 3.4 mph. Weather is not expected to be a meaningful factor in this game. Historical weather data for this game is preserved in the panel below.

67.3°F
East Tennessee State allowed 427 total yards in the first half alone, falling behind 48-7 at halftime. The Buccaneers' defense struggled to contain Tennessee's passing and rushing attacks, which could be a concern heading into their next game.
East Tennessee State managed only 17 points against Tennessee's defense, which was a focus for the Volunteers after a poor performance the previous week. The Buccaneers' offense will need to improve to compete in future games.
East Tennessee State will face West Georgia next Saturday. This game presents an opportunity for the Buccaneers to bounce back and address the weaknesses exposed by Tennessee, particularly on defense and offensive consistency.
East Tennessee State travels 90 miles to this game, a short road trip.
Tennessee won by 55 in a dominant performance.
Tennessee covered the spread comfortably.
The total went Over by 30.5 points.
Blue Chip Analytics power ratings favour Tennessee (16.9) over East Tennessee State (-20.6) by 37.5 points on a neutral field. After adding home field advantage, the rating-implied line may differ meaningfully from the market spread. Tennessee brings one of the stronger home environments in the FBS to this matchup (Blue Chip HFA: 3.1). Add this to the neutral-site differential to arrive at a venue-adjusted line.
Blue Chip Analytics power ratings represent expected point margin against an average FBS opponent on a neutral field, calculated from game data sourced via CollegeFootballData.com (CFBD). They are one input: cross-reference with the travel, rest, and weather data above before drawing conclusions.
Tennessee won and Tennessee covered the spread.


