Virginia defeated Virginia Tech 27–7 to secure a comfortable win. Virginia covered by 11.5; Game went Under by 18.5.
Adjust any factor to update your projected line
Positive adjustment = favours home team
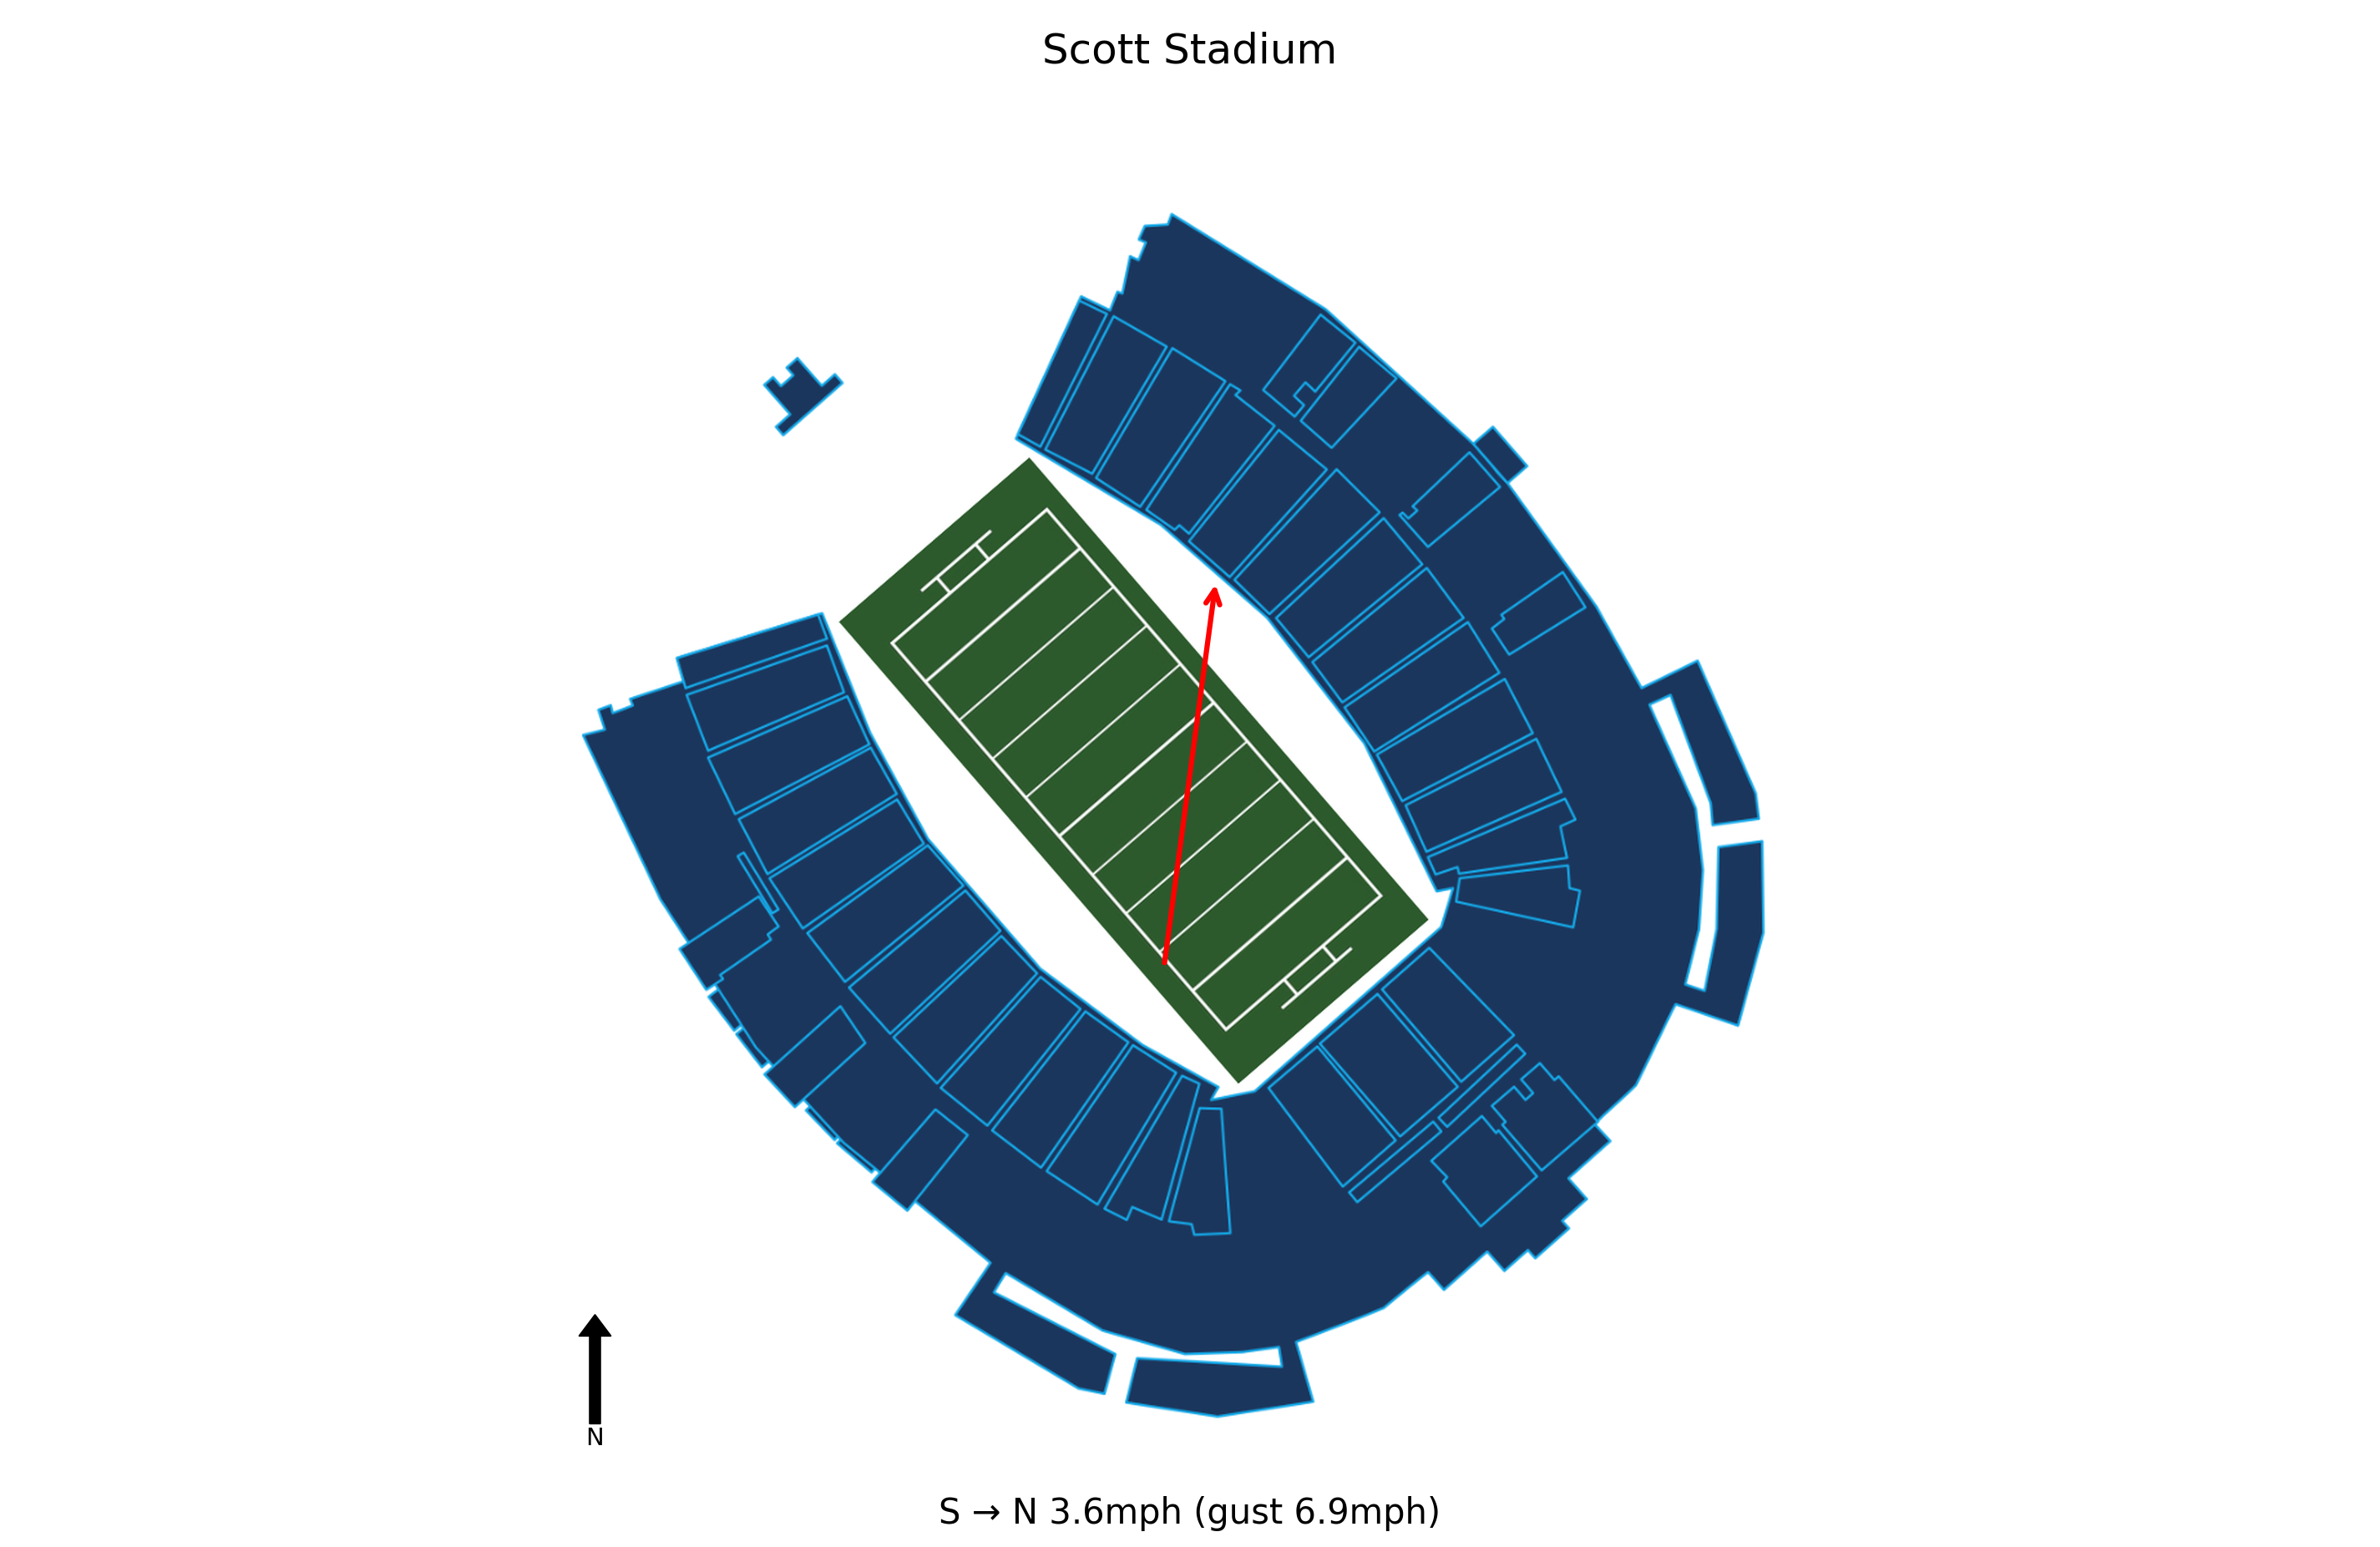
At kick-off, conditions at Scott Stadium were Overcast, 32.2°F, Wind Chill 27.0°F with winds of 3.6 mph. At 32.2°F, cold conditions may be a minor factor in this game. Historical weather data for this game is preserved in the panel below.

32.2°F
Virginia Tech travels 118 miles to this game, a short road trip.
Virginia won by 20 to secure a comfortable win.
Virginia covered the spread by a solid margin.
The total went Under by 18.5 points.
At 32.2°F, cold conditions may be a minor factor in this game.
Full conditions are shown in the data panel above. Forecast data sourced from WeatherAPI.com. Use the Line Value Calculator to apply a manual weather adjustment to your projected line.
Blue Chip Analytics power ratings favour Virginia (12.0) over Virginia Tech (1.7) by 10.3 points on a neutral field. After adding home field advantage, the rating-implied line may differ meaningfully from the market spread. Virginia brings a meaningful home field advantage to this matchup (Blue Chip HFA: 2.0). Add this to the neutral-site differential to arrive at a venue-adjusted line.
Blue Chip Analytics power ratings represent expected point margin against an average FBS opponent on a neutral field, calculated from game data sourced via CollegeFootballData.com (CFBD). They are one input: cross-reference with the travel, rest, and weather data above before drawing conclusions.
Virginia won and Virginia covered the spread.


