Hawai'i defeated California 35–31 in a closely contested finish. Hawai'i covered by 2.5; Game went Over by 15.5. Blue Chip Analytics had rated California 3.8 points stronger on a neutral field.
Adjust any factor to update your projected line
Positive adjustment = favours home team
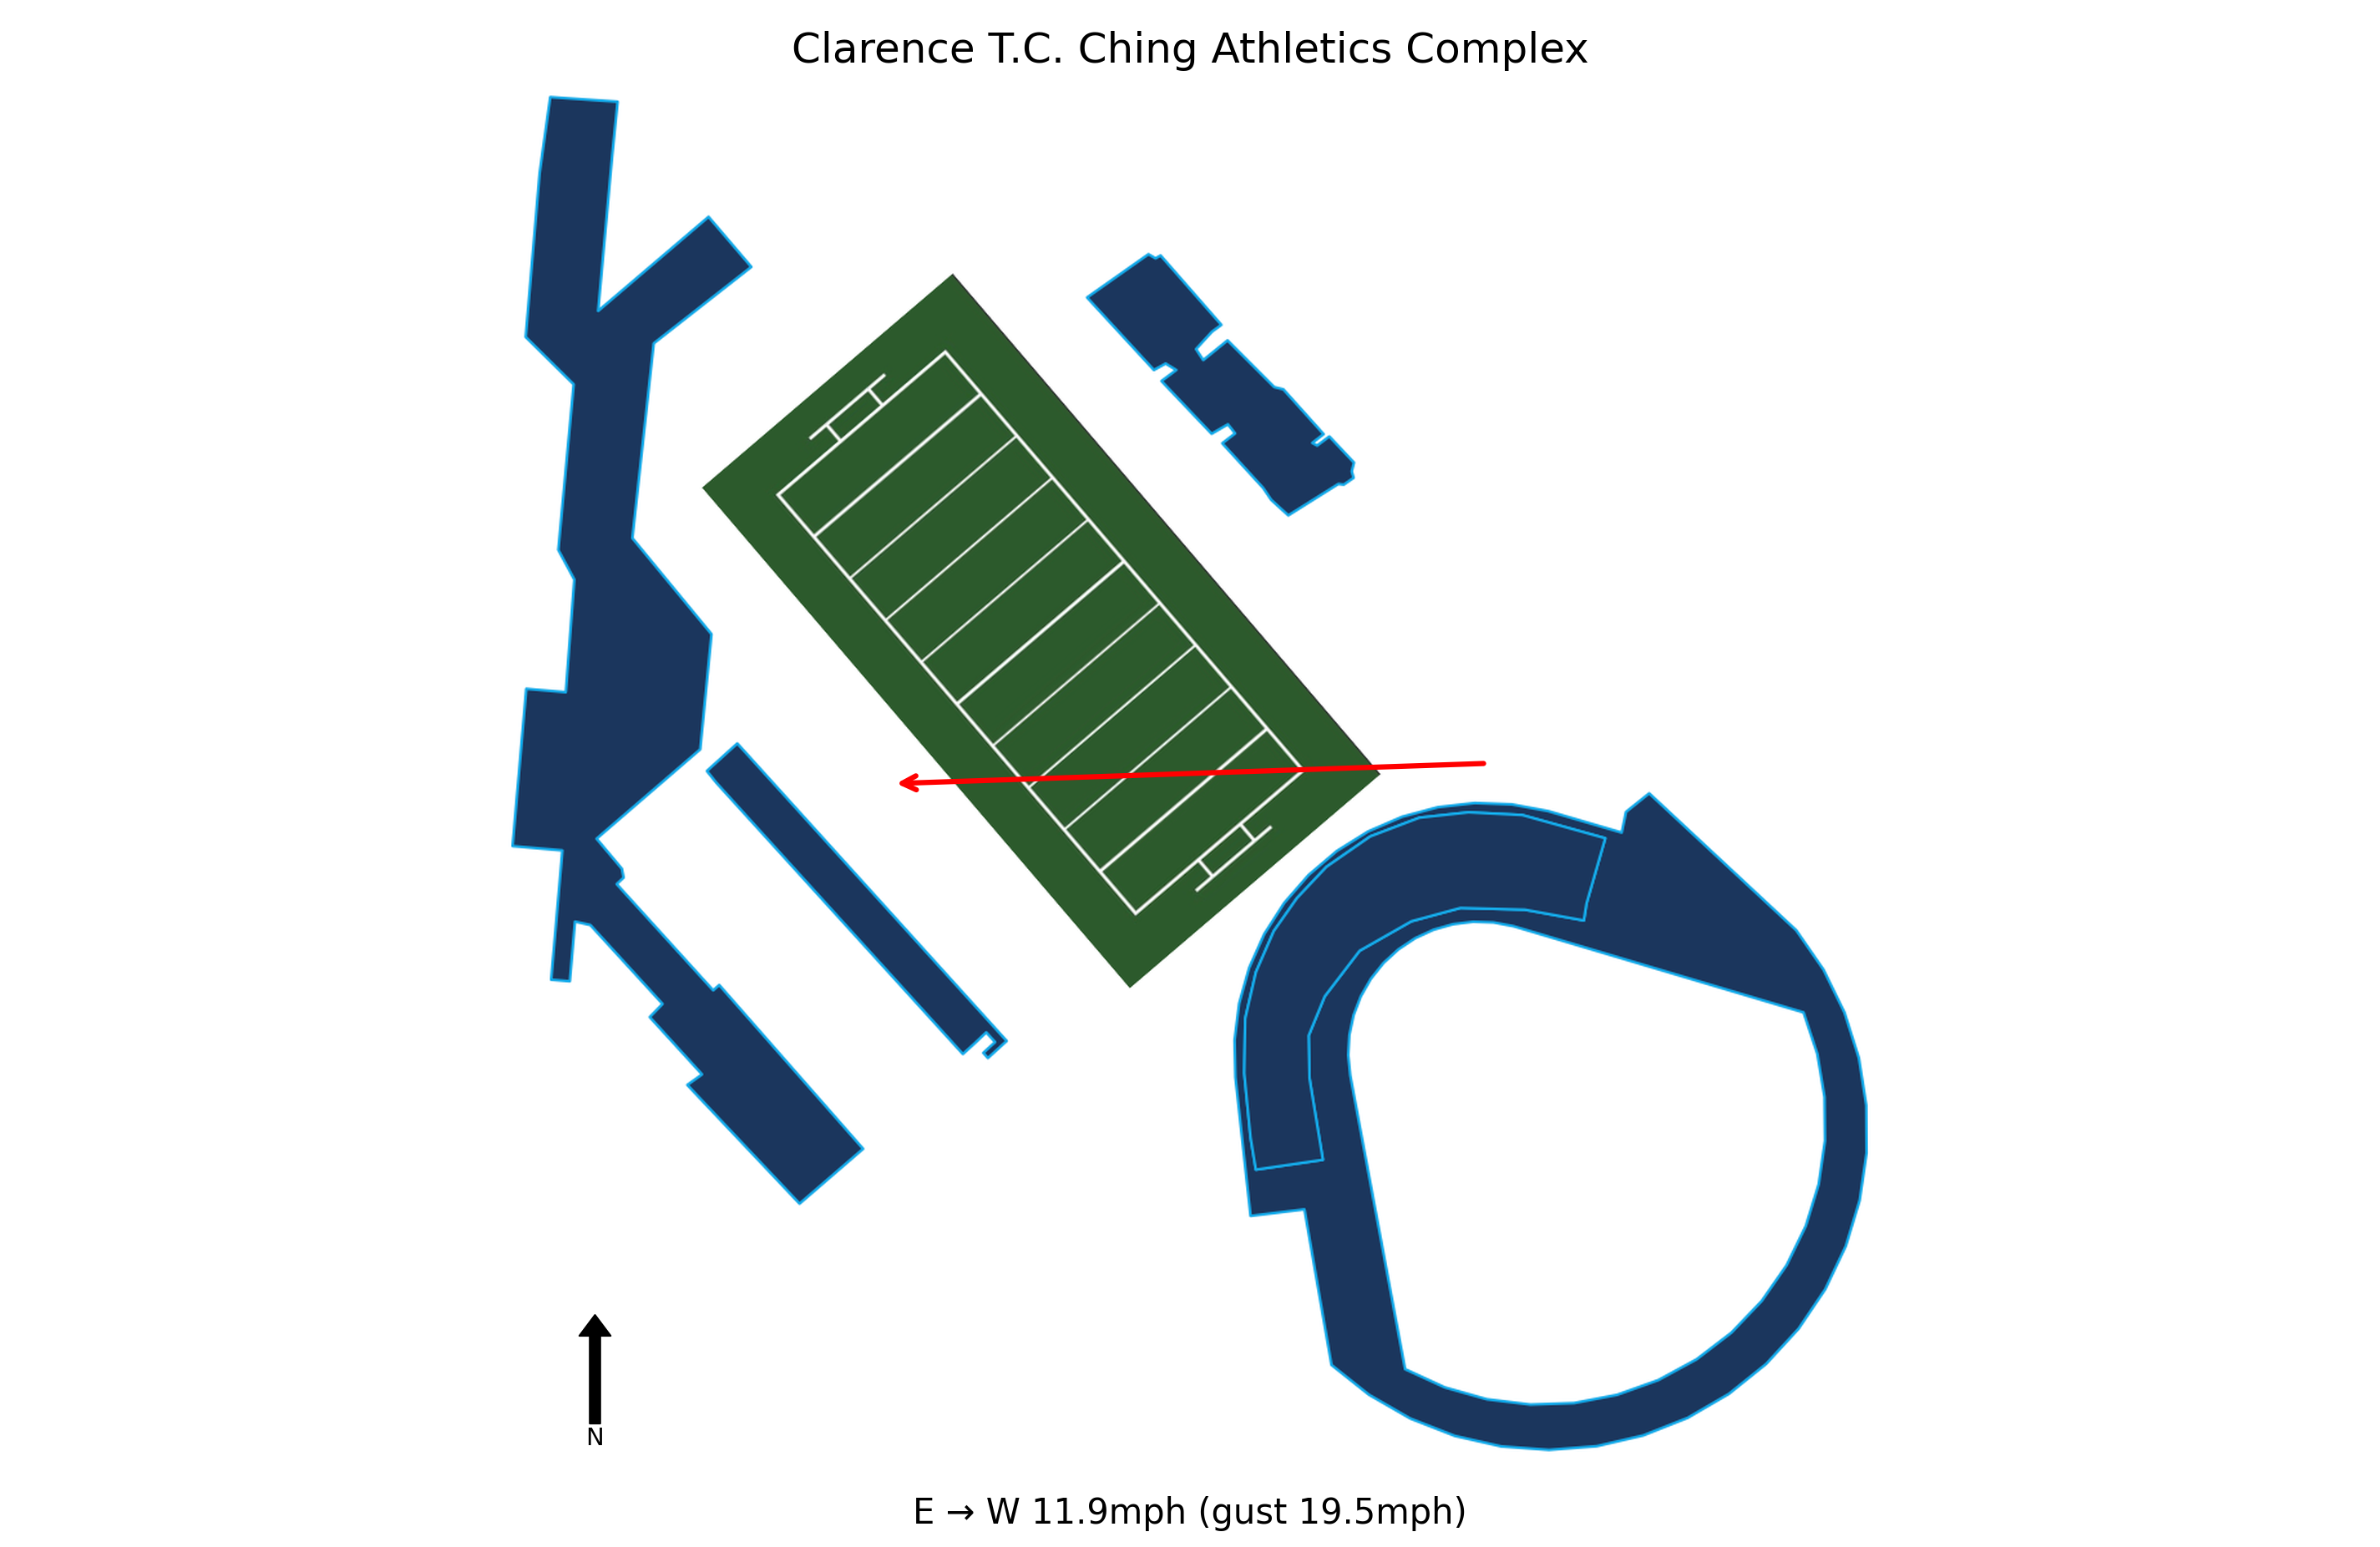
At kick-off, conditions at Clarence T.C. Ching Athletics Complex were Clear, 70.5°F, Feels Like 70.5°F with winds of 11.9 mph. Weather is not expected to be a meaningful factor in this game. Historical weather data for this game is preserved in the panel below.

70.5°F
California travels 2,406 miles to this game, a cross-country trip.
California arrives with a 2-hour body clock disadvantage.
Hawai'i won by 4 in a closely contested finish.
Hawai'i covered the spread narrowly.
The total went Over by 15.5 points.
Blue Chip Analytics power ratings favour California (-0.6) over Hawai'i (-4.4) by 3.8 points on a neutral field. Despite playing at home, Hawai'i faces a power rating deficit. Check whether the market spread accounts for this gap. Hawai'i brings a neutral home environment to this matchup (Blue Chip HFA: 0.0). Add this to the neutral-site differential to arrive at a venue-adjusted line.
Blue Chip Analytics power ratings represent expected point margin against an average FBS opponent on a neutral field, calculated from game data sourced via CollegeFootballData.com (CFBD). They are one input: cross-reference with the travel, rest, and weather data above before drawing conclusions.
Hawai'i won and Hawai'i covered the spread.


