California defeated Texas Southern 35–3 in a dominant performance. Texas Southern covered by 12.5; Game went Under by 16.5.
Adjust any factor to update your projected line
Positive adjustment = favours home team
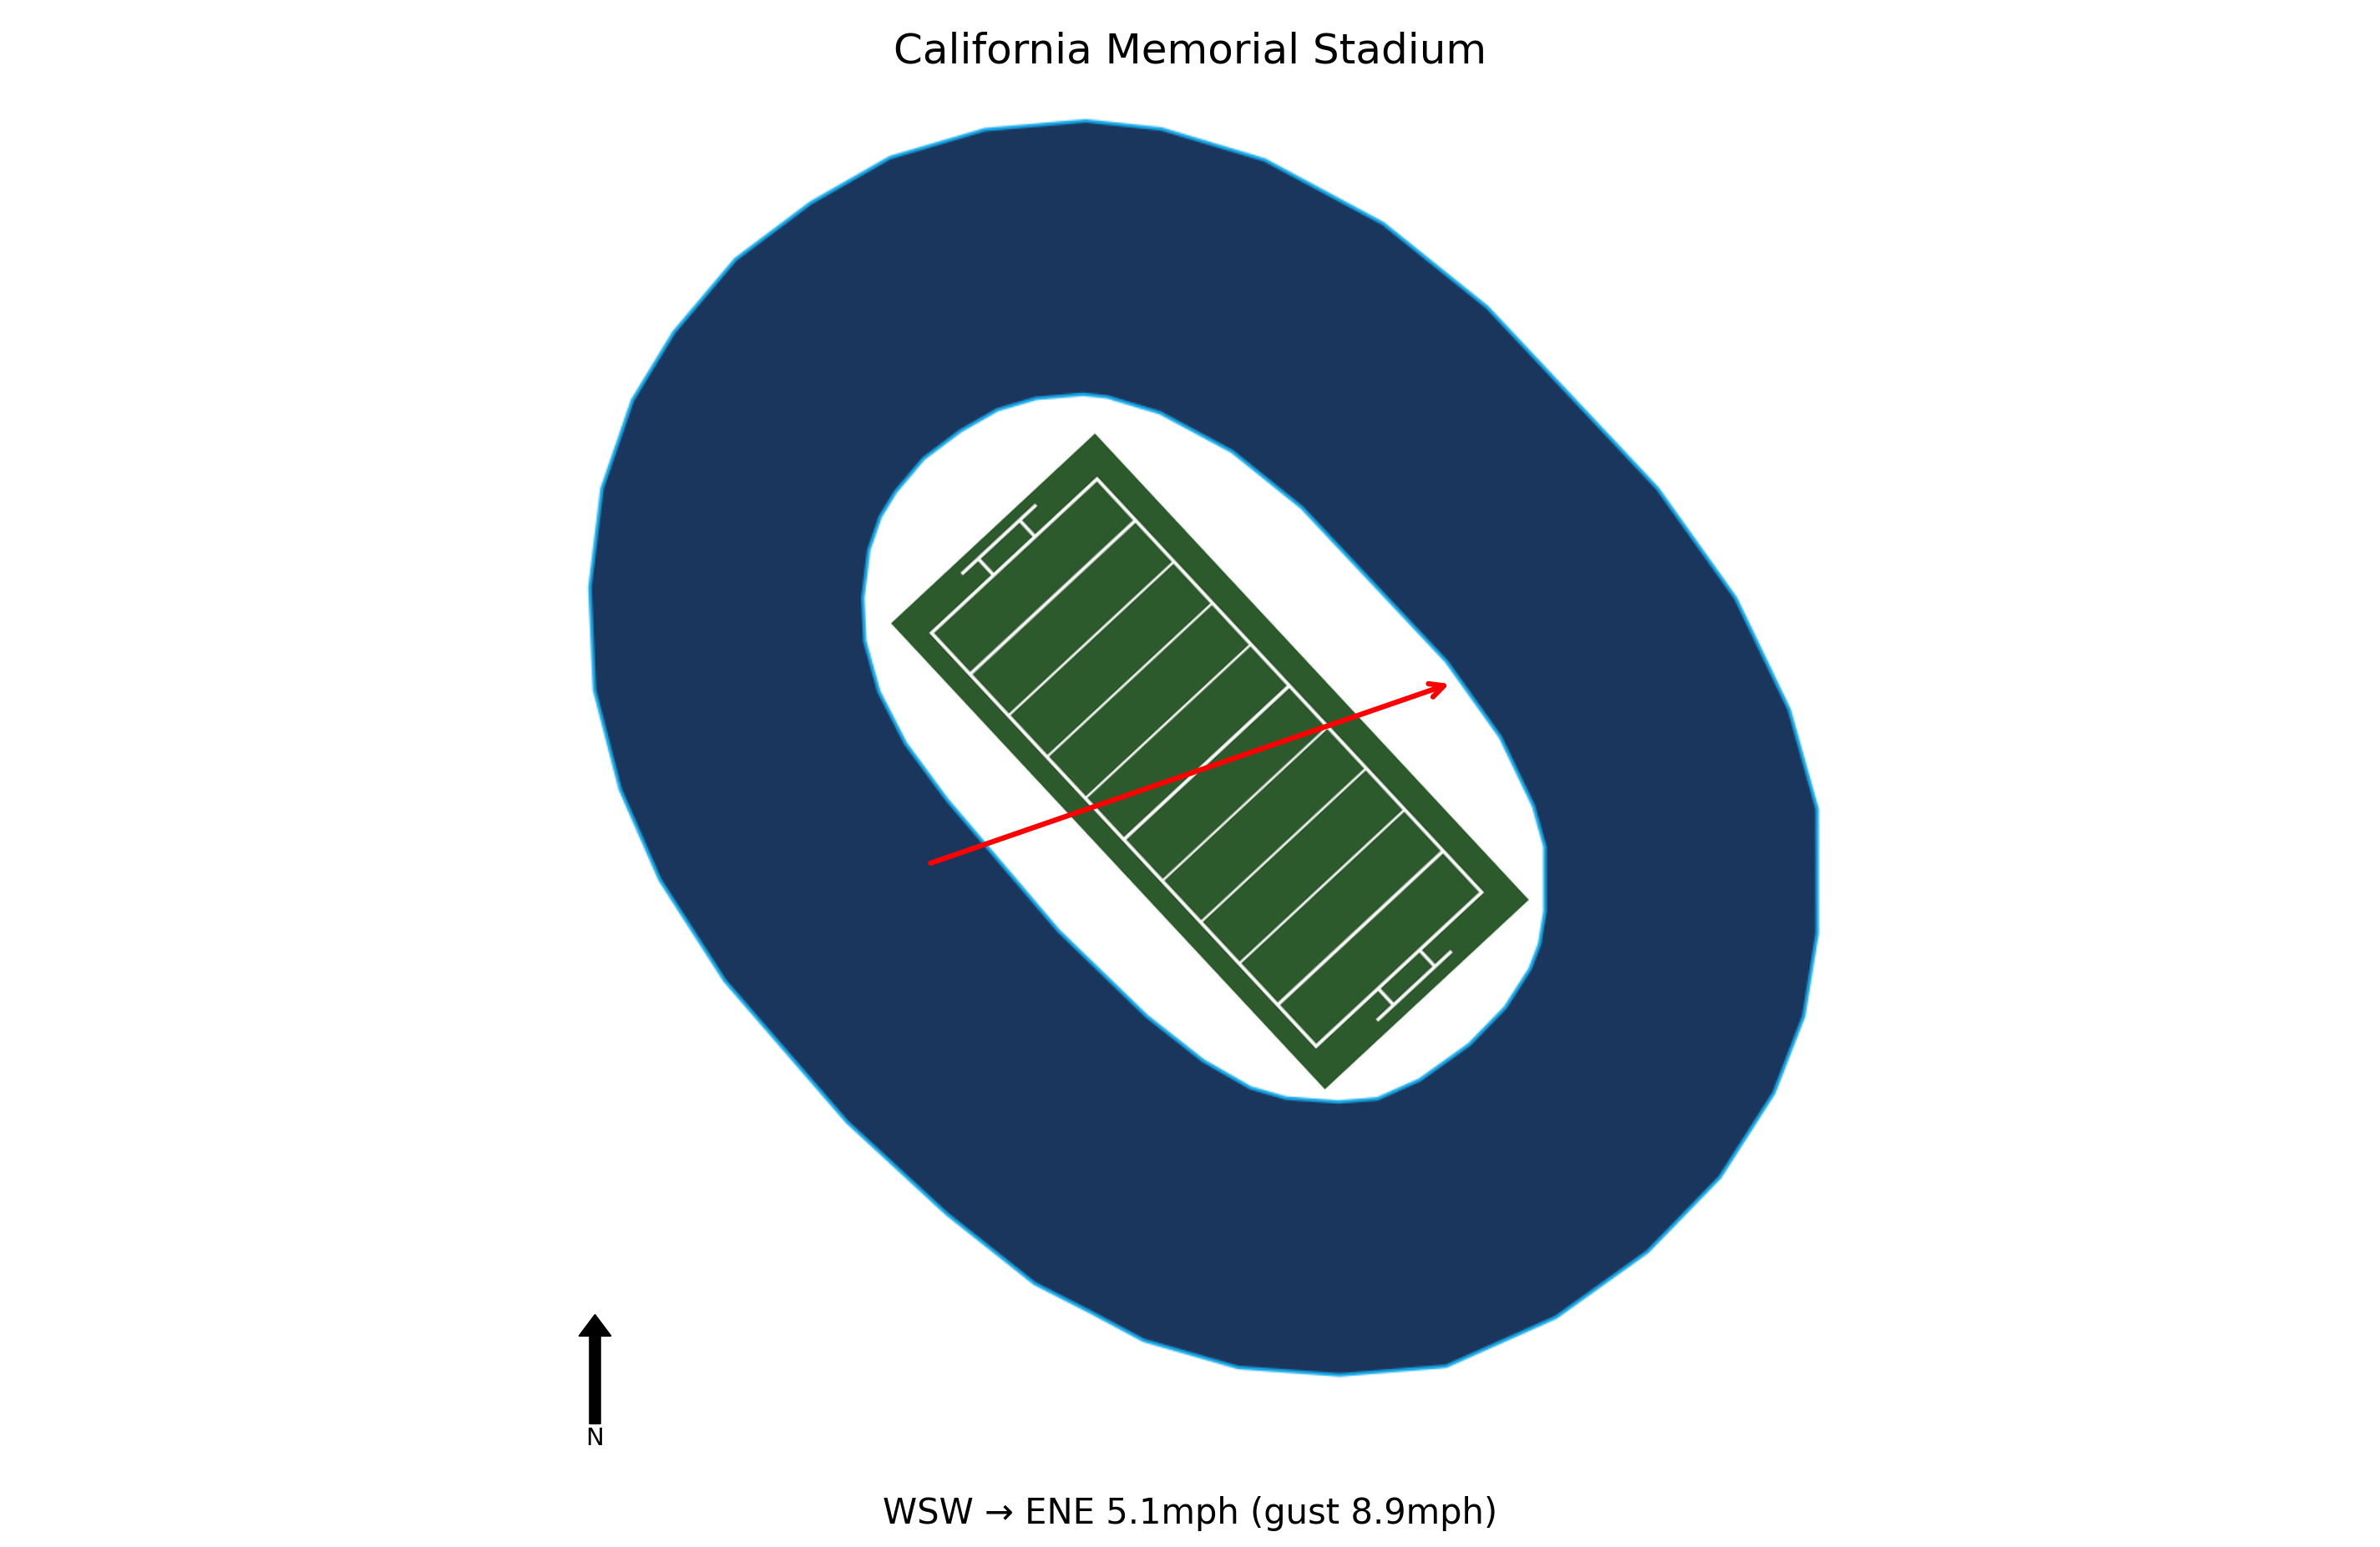
At kick-off, conditions at California Memorial Stadium were Partly cloudy, 58.6°F, Feels Like 57.2°F with winds of 5.1 mph. Weather is not expected to be a meaningful factor in this game. Historical weather data for this game is preserved in the panel below.

58.6°F
The Tigers' offense lacked rhythm, managing only 194 total yards and converting just 3 of 14 third downs, with quarterback KJ Cooper's scrambling being the only bright spot.
Texas Southern's defense was gashed by Cal's running game, allowing 131 yards and a touchdown to Kendrick Raphael, and struggled to pressure the quarterback or stop the run up the middle.
The Tigers were held scoreless until a fourth-quarter field goal, marking their only points of the game and highlighting a lack of explosive plays or sustained drives.
Facing Lamar University next, Texas Southern must improve offensive consistency and defensive discipline to compete, as their current performance suggests significant adjustments are needed.
Texas Southern travels 1,638 miles to this game, a cross-country trip.
Texas Southern arrives with a 2-hour body clock disadvantage.
California won by 32 in a dominant performance.
Texas Southern covered the spread by a solid margin.
The total went Under by 16.5 points.
Blue Chip Analytics power ratings favour California (-5.6) over Texas Southern (-29.6) by 24.0 points on a neutral field. After adding home field advantage, the rating-implied line may differ meaningfully from the market spread. California brings a meaningful home field advantage to this matchup (Blue Chip HFA: 2.5). Add this to the neutral-site differential to arrive at a venue-adjusted line.
Blue Chip Analytics power ratings represent expected point margin against an average FBS opponent on a neutral field, calculated from game data sourced via CollegeFootballData.com (CFBD). They are one input: cross-reference with the travel, rest, and weather data above before drawing conclusions.
California won and Texas Southern covered the spread.


