Georgia (power rating: 22.5) holds a 21.5-point edge over Tennessee State (1.0) on a neutral field per Blue Chip Analytics. Georgia's home field adds 2.4 points to that edge at Sanford Stadium. See Line Value below.
Adjust any factor to update your projected line
Positive adjustment = favours home team
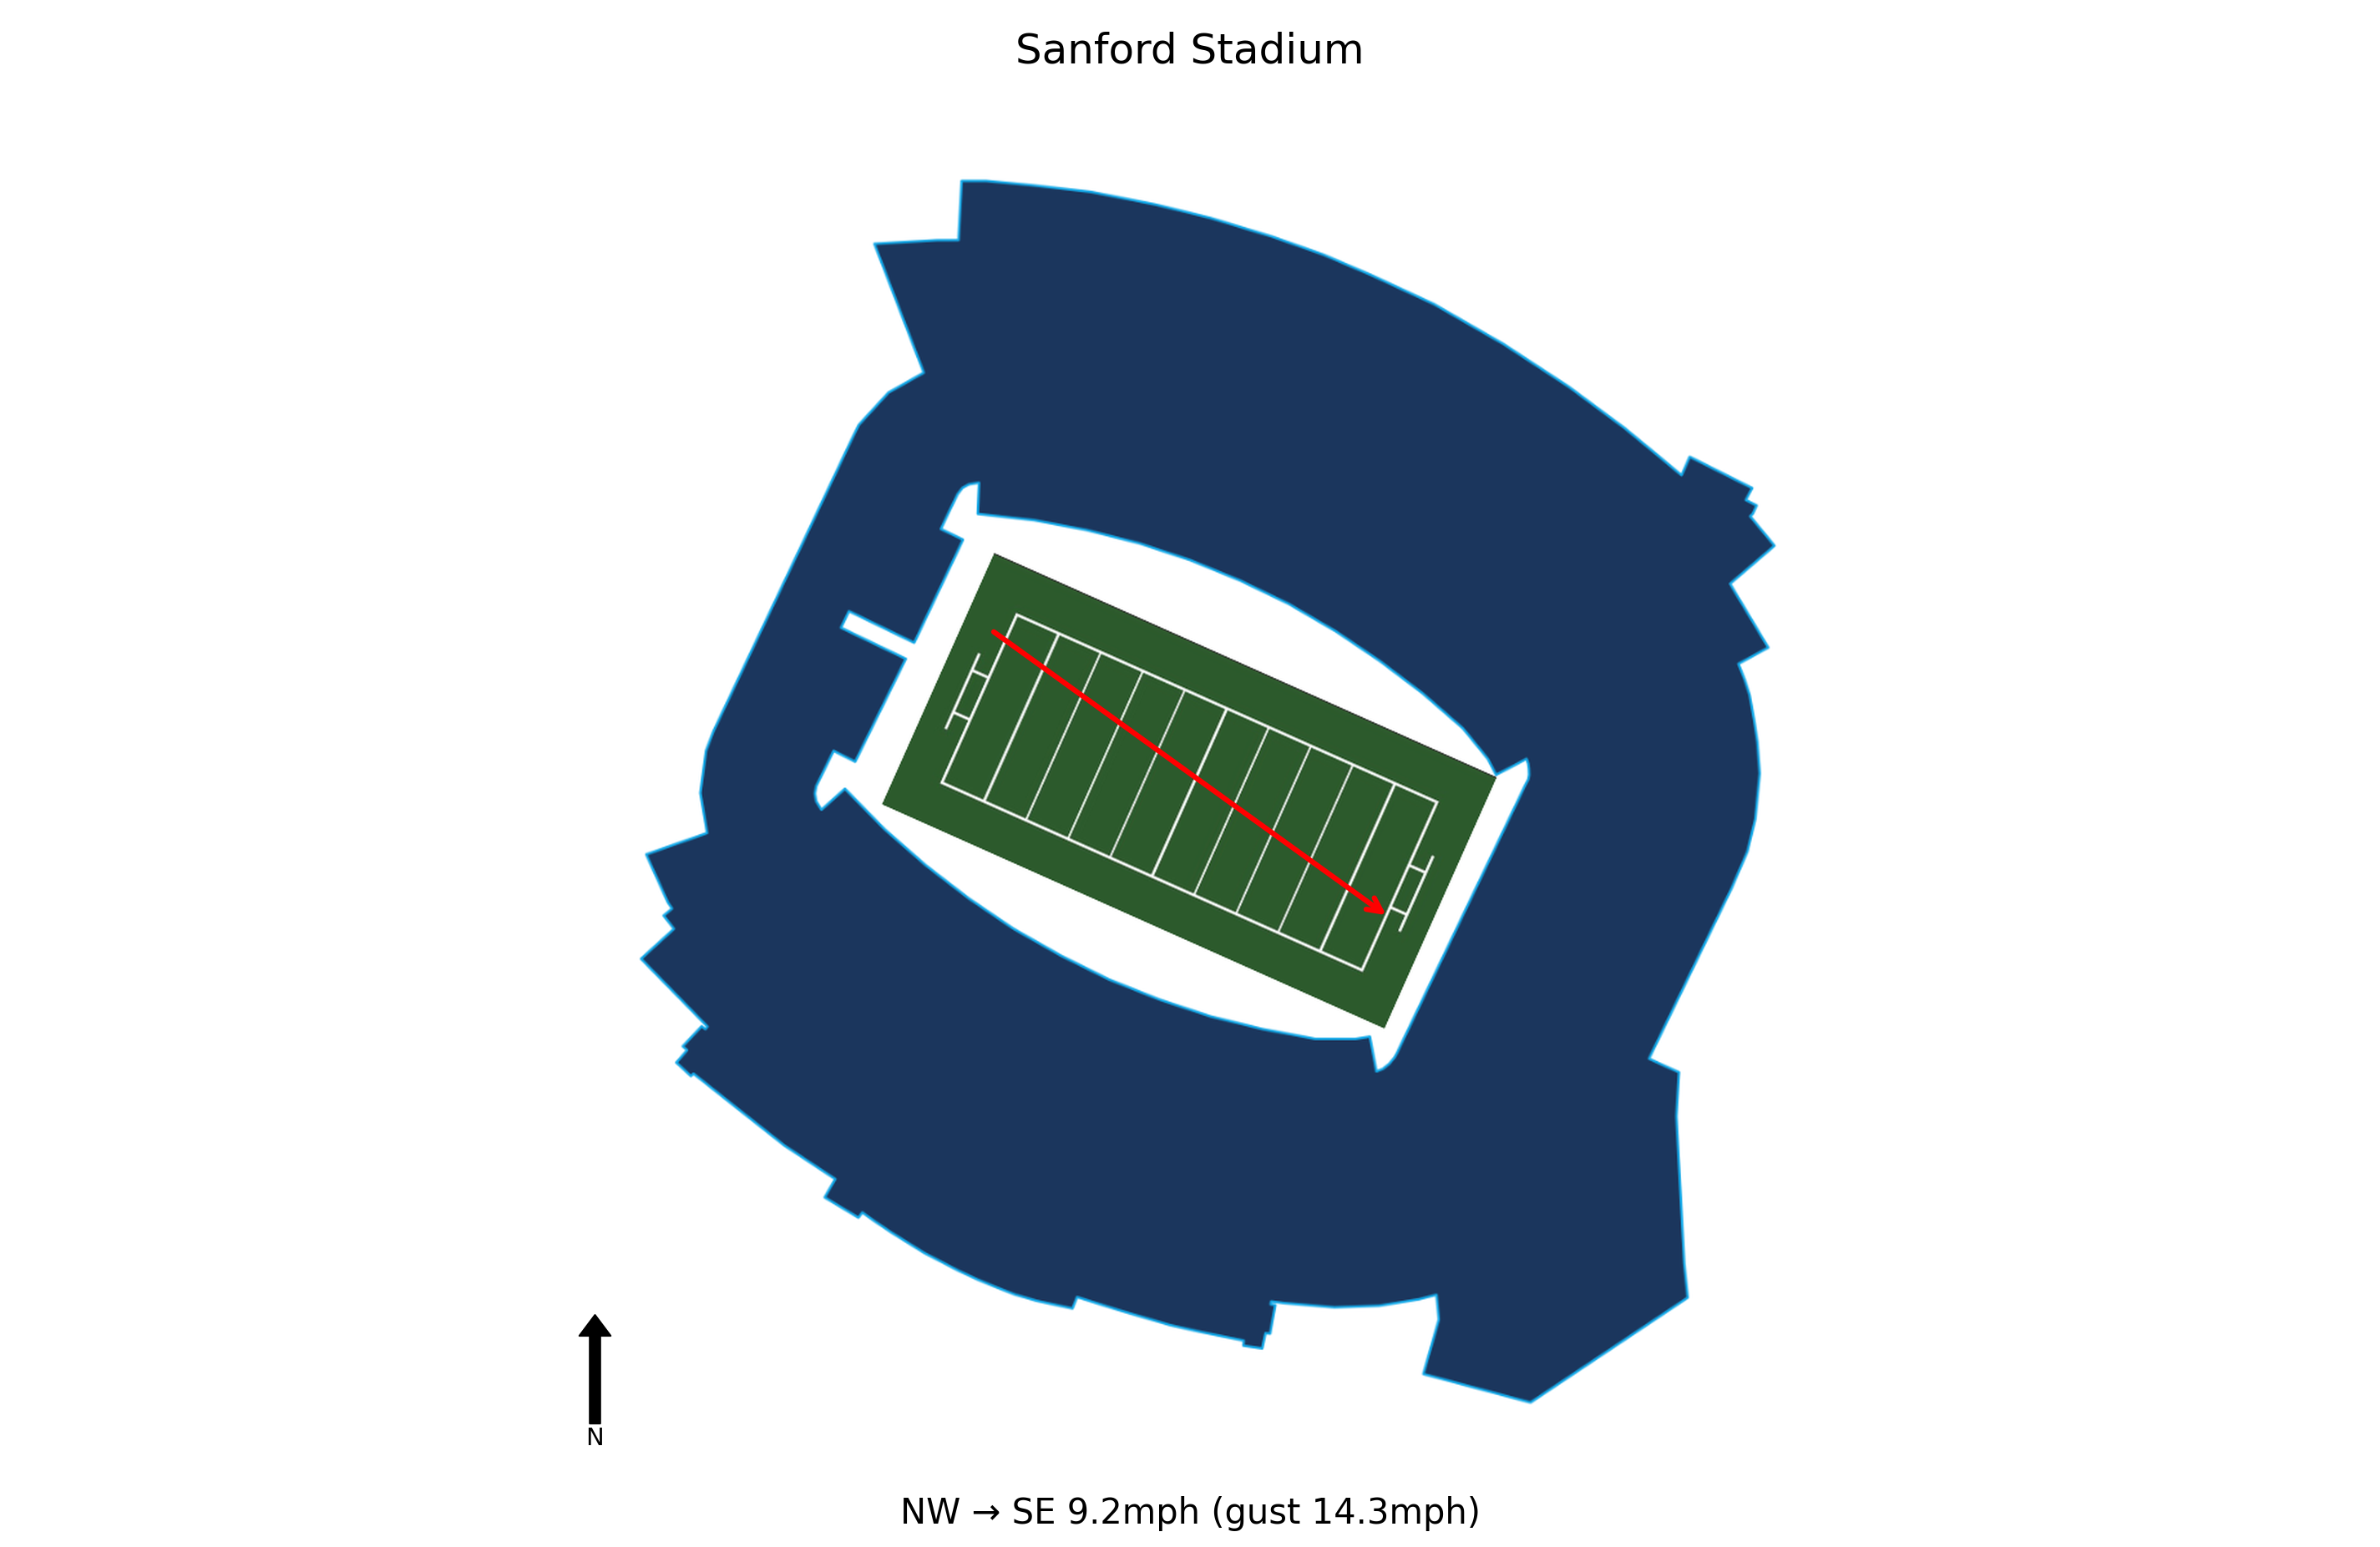
Game-time forecast at Sanford Stadium shows Partly Cloudy — 83.3°F, Heat Index 86.9°F with winds of 9.2 mph. Weather is not expected to be a meaningful factor in this game. The weather adjustment has been pre-filled in the Line Value Calculator above — adjust manually if conditions change before kick-off.

83.3°F
Gunner Stockton's ability to minimize mistakes and play within the offense will be critical. The preseason analysis highlighted his inconsistency, and the team's offensive philosophy is to avoid turnovers and let the run game set the tempo. Against an overmatched opponent, Stockton should have a clean game to build confidence.
Georgia's deep and talented backfield, led by Nate Frazier and supported by Chauncey Bowens, Dante Dowdell, and Dwight Phillips Jr., should overwhelm Tennessee State. The offensive line returns four experienced starters, and the game plan will likely emphasize a heavy run attack to control the clock and limit exposure for Stockton.
Georgia returns 21 defenders with meaningful playing time, including a strong front seven anchored by Xzavier McLeod and Elijah Griffin. The defense should dominate an FCS opponent, especially with the pass rush from Quintavius Johnson and Chase Linton. This game is an opportunity to build depth and test rotations.
The game is at home with a 2.4-point venue HFA, clear weather, and mild temperatures (56°F, light wind). These ideal conditions should allow Georgia to execute their game plan without weather-related disruptions, further favoring a comfortable win.
With a thin margin for error noted in scouting reports, this game allows Georgia to develop younger players like Zykie Helton and Jahzare Jackson on the offensive line, and Chase Linton on defense. Getting meaningful snaps for backups is crucial for building depth for SEC play.
Tennessee State travels 246 miles to this game, a short road trip.
Tennessee State arrives with a 1-hour body clock shift.
Blue Chip Analytics power ratings favour Georgia (22.5) over Tennessee State (1.0) by 21.5 points on a neutral field. After adding home field advantage, the rating-implied line may differ meaningfully from the market spread. Georgia brings a meaningful home field advantage to this matchup (Blue Chip HFA: 2.4). Add this to the neutral-site differential to arrive at a venue-adjusted line.
Blue Chip Analytics power ratings represent expected point margin against an average FBS opponent on a neutral field, calculated from game data sourced via CollegeFootballData.com (CFBD). They are one input — cross-reference with the travel, rest, and weather data above before drawing conclusions.
Blue Chip Analytics rates Georgia as the stronger team by 21.5 points on a neutral field; apply HFA and travel context before finalising a line read.


